As SUV sales plummet and gasoline use finally drops, one meme spreading around is, “Looks like people respond to price after all.” The implication seems to be that any demand response other than zero proves that prices are wonderfully effective.
The problem, however, is not response is or might be zero. (I can think of few who ever claimed that.) The problem is that it takes a big price increase to produce a small response.
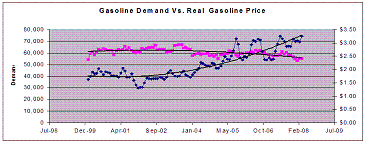
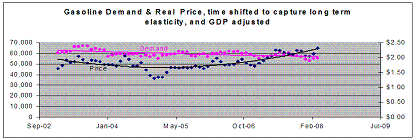
The current data support the conventional wisdom: 40 to 50 percent long-term elasticity, low enough to discourage us from relying on price as the main means of reducing emissions, high enough encourage us to use price as one among many means. At first glance, the raw data are even more discouraging than the conventional wisdom: Inflation adjusted gasoline prices have risen almost two-and-a-half times since 2000. Gasoline demand has dropped by slightly over 20 percent. But long-term elasticity is, by definition, a delayed response — at least three years.
Also, if we are interested in price response as opposed to income response, we have to adjust for growth in GDP. So a rough calculation yields 45 percent long-term elasticity (with some biases that probably overstate the result). Here are two graphs, the first of raw data, the second after adjustment (click for larger versions):
You find raw data on which these graphs are based here:
Gas prices from the EIA [Excel worksheet]
Consumption from the EIA [Excel worksheet]
Real GDP from the BEA [Excel worksheet]
My quick and dirty analysis to derive the graphs [Excel worksheet]


