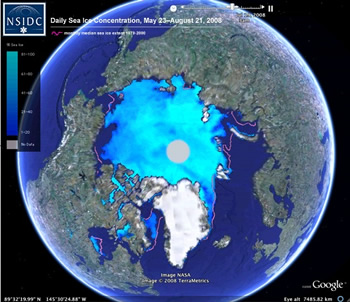
Fresh from its Olympic-record in denier debunking, the National Snow and Ice Data Center has released a new update:
Sea ice extent is declining at a fairly brisk and steady pace. Surface melt has mostly ended, but the decline will continue for two to three more weeks because of melt from the bottom and sides of the ice. Amundsen’s Northwest Passage is now navigable; the wider, deeper Northwest Passage through Parry Channel may also open in a matter of days. The Northern Sea Route along the Eurasian coast is clear.
NSIDC has put together a nice animation (click on figure):
More details below:
Arctic sea ice extent on August 24 was 5.47 million square kilometers (2.11 million square miles), a decline of 1.85 million square kilometers (714,000 square miles) since the beginning of the month. Extent is now within 580,000 square kilometers (220,000 square miles) of last year’s value on the same date and is 1.84 million square kilometers (710,000 square miles) below the 1979 to 2000 average.
The NSIDC has a fascinating discussion of ice thickness, for all you surface and bottom melt buffs out there:
As discussed in a number of previous postings (July 17, April 7), sea ice thickness is a key measure of the health of the sea ice. While the NASA ICESat sensor can give an overall picture of ice thickness over the Arctic Ocean, the most accurate way to measure ice thickness is by taking point measurements on the ground [with autonomous buoys] … The buoy data have indicated increased amounts of melt on the underside of the ice cover in recent years; bottom melt last year was particularly extreme.
The pattern for 2008 has been more mixed. The ice at some buoy locations has thinned by more than a meter through the melt season because of strong melt both on the surface and the underside of the ice. Other locations show strong thinning caused by surface melt, while only modest thinning is apparent in others. Differences in surface melt from location to location reflect factors such as air temperature, the ice albedo, and cloud conditions. The wide range in bottom melt points to variations in the amount of ocean heat absorbed. In recent days, the buoys have indicated sub-freezing temperatures with surface melt coming to an end; however, bottom melt will continue for at least two to three more weeks and the ice extent decline, while slowing, will also continue.
This post was created for ClimateProgress.org, a project of the Center for American Progress Action Fund.


