The New York Times published an article yesterday titled “Silicon Valley Starts to Turn Its Face to the Sun“:
“This is the biggest market Silicon Valley has ever looked at,” says T. J. Rogers, the chief executive of Cypress Semiconductor, which is part-owner of the SunPower Corporation, a maker of solar cells in San Jose, Calif.
“The solar industry today is like the late 1970s when mainframe computers dominated, and then Steve Jobs and I.B.M. came out with personal computers,” says R. Martin Roscheisen, the chief executive of Nanosolar, a solar company in San Jose, Calif.
Why all the excitement? You need only look at a few numbers and a graph to get the picture.
- Seventy-six percent of all electrical energy produced in this country is used to operate buildings.
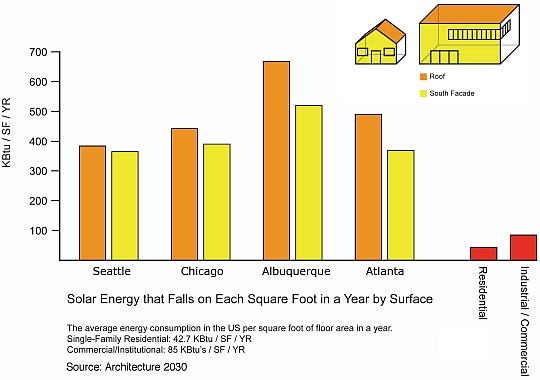
- The average residence in the U.S. consumes approximately 42.7 KBtu/SF/YR of delivered energy and the average commercial building about 85 KBtu/SF/YR.
- Between 384 KBtu/SF/YR (Seattle) and 667 KBtu/SF/YR (Albuquerque) of solar energy is delivered free to every square foot of roof in the U.S. Between 365 KBtu/SF/YR (Seattle) and 520 KBtu/SF/YR (Albuquerque) of solar energy is delivered free to every unshaded south wall (south-facing surface) in the U.S. Or, to put it another way, between 749 KBtu/SF/YR and 1,187 KBtu/SF/YR of solar energy is delivered free to two surfaces of every building in the U.S.
A message from
Your support keeps our climate news free.
Grist is the only award-winning newsroom focused on exploring equitable solutions to climate change. It’s vital reporting made entirely possible by loyal readers like you.
At Grist, we don’t believe in paywalls. Instead, we rely on our readers to pitch in what they can so that we can continue bringing you our solution-based climate news. Donate today to keep our site free.