On March 7, 2011, Arctic sea ice likely reached its maximum extent for the year, at 14.64 million square kilometers (5.65 million square miles). The maximum extent was 1.2 million square kilometers (463,000 square miles) below the 1979 to 2000 average of 15.86 million square kilometers (6.12 million square miles), and equal (within 0.1%) to 2006 for the lowest maximum extent in the satellite record.
On Monday, the National Snow and Ice Data Center announced the maximum, “the largest sea ice extent during a given year.” It “marks the end of the growth period for sea ice, and the start of the melt season.”
This isn’t a big surprise since the Arctic has seen the lowest December, January, and February (tied with 2005) sea ice extent in satellite record. The more important three-dimensional metric of ice volume also continues its long-term decline (see Navy’s oceanographer tells Congress, “the volume of ice as of last September has never been lower…in the last several thousand years”)
Here’s more from NSIDC, plus their plot of sea ice extent:
As of March 22, ice extent has declined for five straight days. However there is still a chance that the ice extent could expand again. Sea ice extent in February and March tends to be quite variable, because ice near the edge is thin and often quite dispersed. The thin ice is highly sensitive to weather, moving or melting quickly in response to changing winds and temperatures, and it often oscillates near the maximum extent for several days or weeks, as it has done this year.
Since the start of the satellite record in 1979, the maximum Arctic sea ice extent has occurred as early as February 18 and as late as March 31, with an average date of March 6.
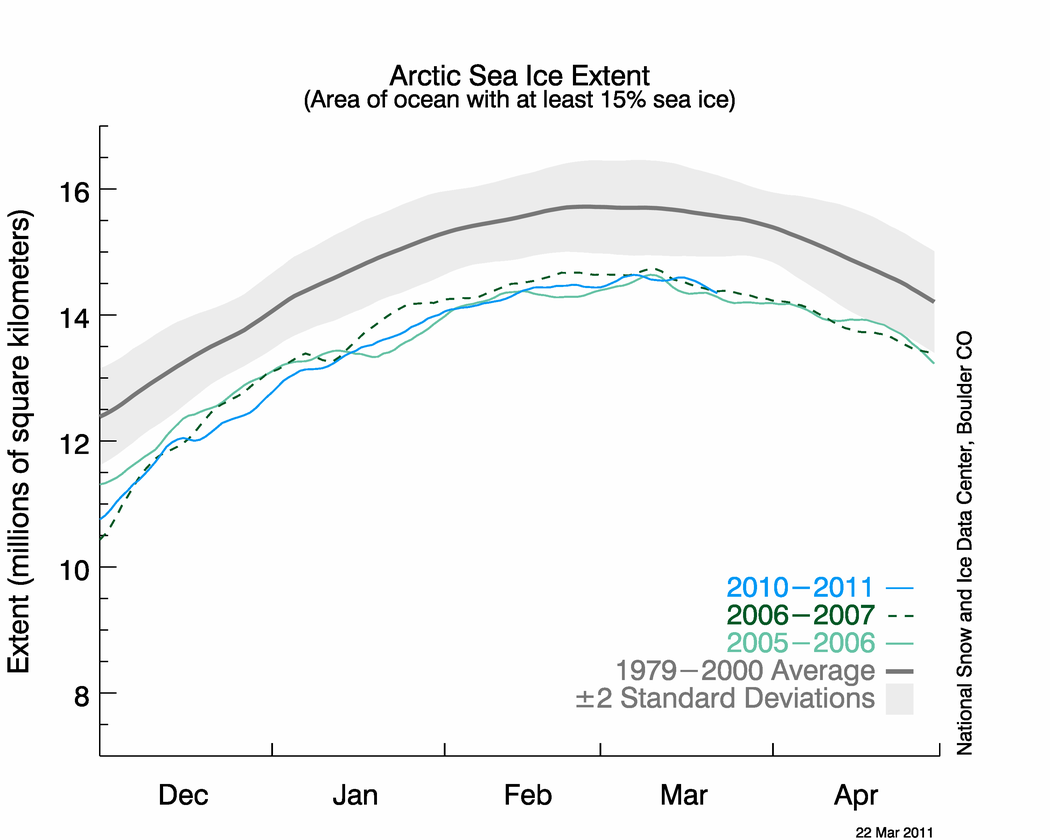
The graph above shows daily Arctic sea ice extent as of March 22, 2011, along with daily ice extents for 2006, which had the previous lowest maximum extent, and 2007, the year with the lowest minimum extent in September. Light blue indicates 2011, green shows 2007, light green shows 2006, and dark gray shows the 1979 to 2000 average. The gray area around the average line shows the two standard deviation range of the data.
The death spiral lives, as it were:
- Serreze: Arctic is “continuing down in a death spiral. Every bit of evidence we have says the ice is thinning.”
- Temperatures of North Atlantic “are unprecedented over the past 2000 years and are presumably linked to the Arctic amplification of global warming” — Science
- Polar bear, Arctic sea ice all-but doomed: Misleading Nature cover story misleads the media, public