Every year, consulting firm Black & Veatch conducts a survey of people in the U.S. utility sector, mostly executives and managers, soliciting their opinions on trends, technologies, and strategies in the power industry. This year participation more than doubled, to 700 people. I’ve been looking through the full results (PDF) and was going to write up a summary, but then I discovered B&V already did that for me! Far be it from me to do unnecessary work, so with their permission, I’m going to post their “top 10 insights” from the survey. Then I’ll do a followup post highlighting a few things I think are worth a closer look. This is a bit long for a blog post, but if you’re interested in the direction of electricity in the U.S., it’s packed with interesting details.
——
Top 10 insights from electric utility industry survey results
- Prepare for a “significant” increase in your electric bill over the next five years.
- Coal will remain part of the future energy mix.
- Aging infrastructure is now top operational concern.
- Lack of national energy policy impedes investment in new technology.
- Water and nuclear safety dominate top environmental concerns.
- Natural gas overtakes wind, solar and nuclear as the top “Environmentally Friendly Technology.”
- Water management viewed as a “Potential Game Changer” and energy storage gaining momentum.
- Lack of understanding and funding represent greatest obstacles for smart grid implementation.
- Electric Vehicles will impact utilities’ annual load over time.
- The United States’ competitive position in the renewable energy technology market is at risk.
Prepare for a “significant” increase in your electric bill over the next five years.
Please indicate how strongly you agree or disagree with each of the following statements on a scale of 1 to 5 (where 1 indicates “very strongly disagree”) over the next five years.
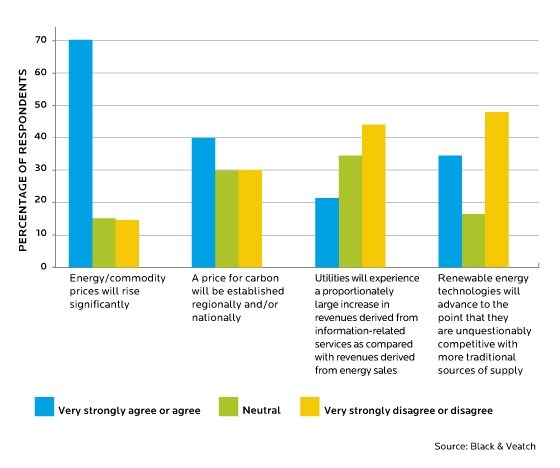
Note: The above chart includes the responses of all survey participants and is not included in the full electric utility survey results.
- More than 70 percent of all respondents agree or strongly agree with the statement energy and commodity prices will rise significantly in the next five years.
- Only 40 percent believe a carbon price will be set.
- Respondents have low expectations for utilities to make money in informational-related areas.
- Nearly half of all respondents disagree or strongly disagree with the statement that renewable energy technology will be competitive with traditional sources of supply within five years.
Coal will remain part of the future energy mix.
Nearly 80 percent believe that, when fiscal realities are considered, coal will remain part of the U.S. energy mix. This percentage exceeds 80 percent when just reviewing utility respondents answers to this question (see page 46 of the full survey results).
Coal-fueled power generation has long been considered among the most economic and cost-effective technologies and fuels for meeting baseload needs. In the previous question, more than 70 percent of respondents believed energy prices will rise significantly in the next five years – and that’s taking into account coal remaining part of the energy equation.
Is there a future for coal?
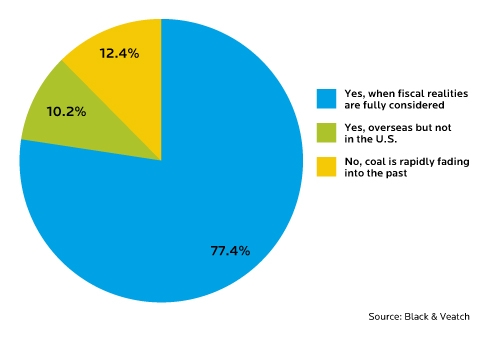
Note: The above chart includes the responses of all survey participants and is not included in the full electric utility survey results.
Aging infrastructure is now top operational concern.
For the first time, aging infrastructure is the top operational concern among all survey respondents, surpassing regulation and reliability.
This concern correlates with findings from the American Society of Civil Engineers’ (ASCE) 2009 Report Card on America’s Infrastructure. Using a traditional grading system of A, B, C, D and F, the ASCE gave America’s energy infrastructure a collective rating of D+, and estimated a total investment need of $75 billion dollars for new or upgraded generation and transmission and distribution assets.
The investment needs outlined by the ASCE provide insights and suggest another source of upward pressure on utility rates in addition to the escalation in energy and commodity prices over the five years.
Please rate the importance of each of the following issues on a scale of 1 to 5 (where 5 indicates “greater importance”)
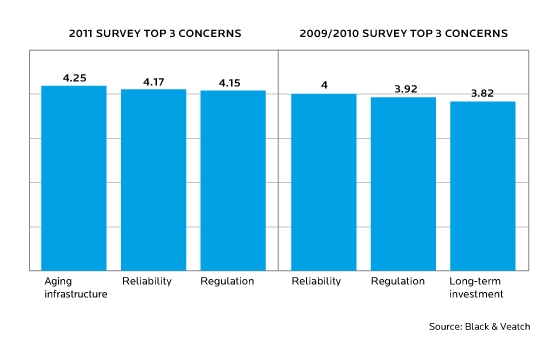
Note: The above chart includes the responses of all survey participants and is not included in the full electric utility survey results.
Lack of national energy policy impedes investment in new technology.
Rodger Smith, President of Black & Veatch’s management consulting business, stated in the survey’s closing commentary (see page 85 of the full survey results), “…lack of a comprehensive and coherent energy policy has encouraged the industry to remain fragmented and stagnant. Having no policy actually is policy…”
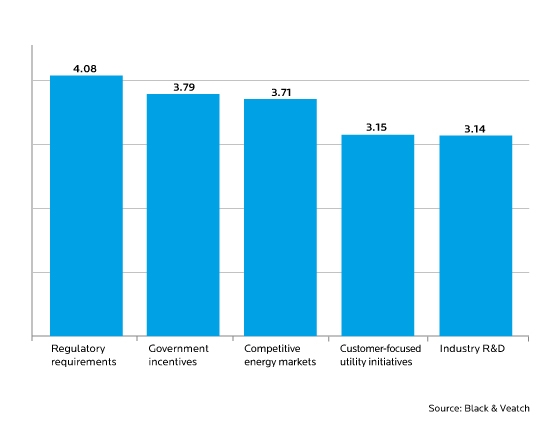
When asked in the survey what factors most motivate the industry to invest in new technology, the two highest rated responses where “Regulatory Requirements” and “Government Incentives,” respectively. With the amount of capital needed to replace aging infrastructure, utilities need a long-term policy to base their long-term technology investment decisions.
Note: The above chart includes the responses of all survey participants and is not included in the full electric utility survey results.
Water and nuclear safety dominate top environmental concerns.
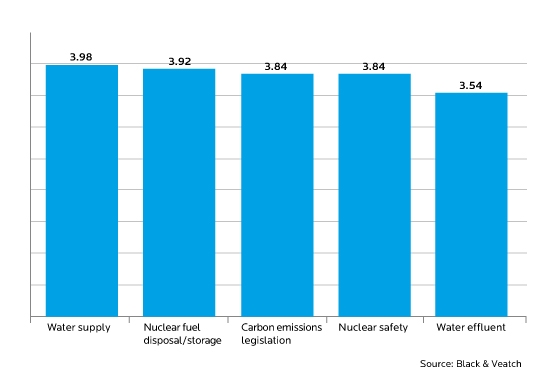
For the first time, water supply was ranked as the top environmental concern within the Black & Veatch survey. In addition, water effluent was also among the top 5 environmental concerns, calling greater attention to the growing importance between the Nexus of Water and Energy.
Please rate the following environmental concerns on a scale of 1 to 5 (where 5 indicates “more concern”)
Note: The above chart includes the responses of all survey participants and is not included in the full electric utility survey results.
Nuclear fuel disposal and storage and nuclear safety also were among the top 5 concerns. This year’s survey was conducted shortly after the tragic eart
hquake and tsunami in Japan. As a result, it is highly likely that responses to this question were influenced by the on-going crisis at the Fukushima Dai-ichi nuclear power plant.
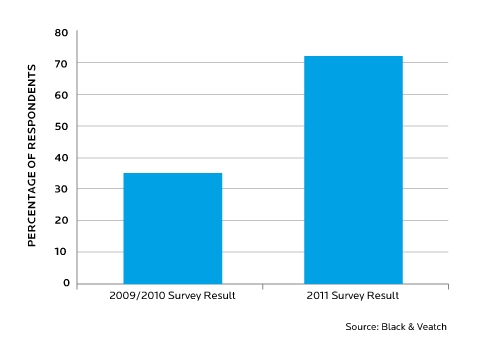
Last year, nuclear was not in the top 3 for this category. As noted below, the percentage of respondents who rated nuclear fuel disposal and storage as an issue they were either “concerned” or “very concerned” with more than doubled.
Interestingly, when viewing only responses from utility participants (see page 45 of the full survey results), carbon legislation and water supply rank first and second.
Percentage of respondents rating “nuclear fuel disposal/storage” as an issue they are “concerned” or “very concerned”
Note: The above chart includes the responses of all survey participants and is not included in the full electric utility survey results.
Natural gas overtakes wind and nuclear as the top “environmentally friendly” technology — but utility execs still prefer nuclear.
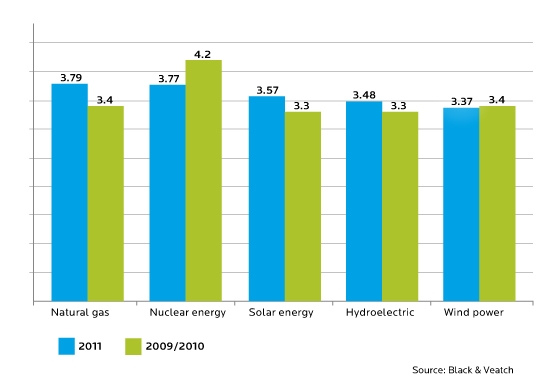
Last year, natural gas ranked third among all survey respondents as the technology the industry should emphasize for meeting future environmental standards, with nuclear taking the top spot followed by wind. This year, natural gas ranked first among all survey respondents, barely edging out nuclear, while wind dropped to fifth in the rankings.
Where do you believe the industry should place its emphasis in environmentally friendly technologies? Please rate on a scale of 1 to 5 (where 5 indicates “more emphasis”).
Note: The above chart includes the responses of all survey participants and is not included in the full electric utility survey results.
When “other” responses are removed from the results to focus on just utility respondents, then nuclear energy remains the top choice, followed closely by natural gas and then hydroelectric (see page 47 of full survey results).
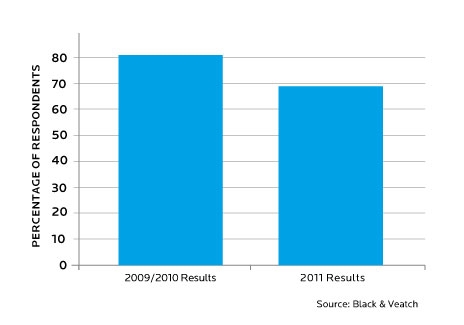
Just as concern for nuclear storage and disposal rose considerably, the percentage of respondents rating nuclear as a 4 or 5 in “technology the industry should emphasize” also dropped by more than 12 percent from the 2009/2010 survey results.
Percentage of respondents rating nuclear as a “4” or “5” in “technology the industry should emphasize.”
Note: The above chart includes the responses of all survey participants and is not included in the full electric utility survey results.
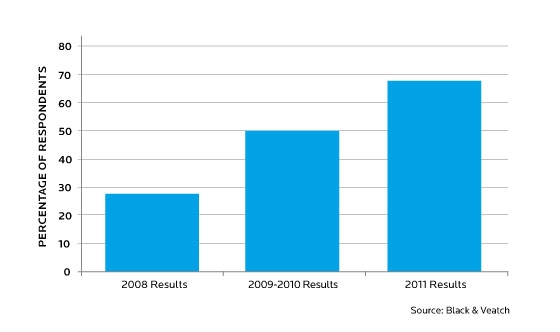
The percentage of respondents rating natural gas as a 4 or 5 in “technology the industry should emphasize” has had year-over-year double-digit growth since 2008.
Percentage of respondents rating natural gas as a “4” or “5” in “technology the industry should emphasize.”
Note: The above chart includes the responses of all survey participants and is not included in the full electric utility survey results.
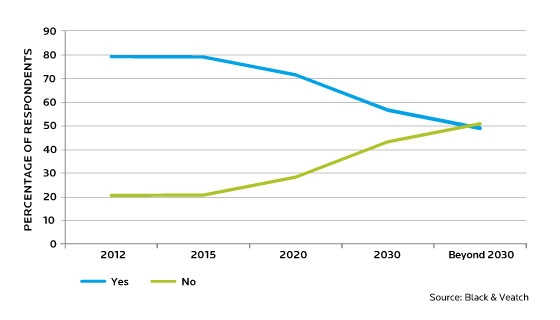
Shale gas may likely have a significant role in natural gas-fueled power generation’s growing popularity. The majority of survey participants indicated they believe shale gas will continue to be available at a reasonable cost through 2030.
Note: The above chart includes the responses of all survey participants and is not included in the full electric utility survey results.
Water management viewed as a “potential game changer” and energy storage gaining momentum.
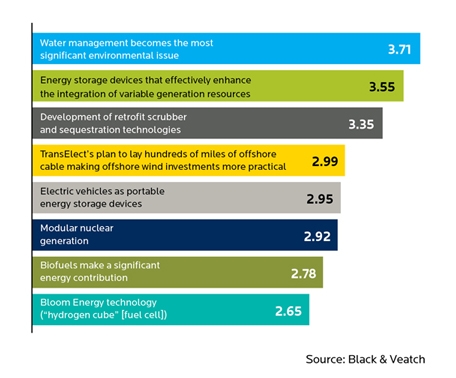
Water management is viewed by all survey respondents as having the greatest potential to significantly impact the industry.
Water management, and therefore the Nexus of Water and Energy, touches many aspects of power generation. A reliable water supply is needed to cool most thermal power generation facilities like coal, natural gas, nuclear and solar thermal. In addition, as noted in the previous question, natural gas is the technology the majority of industry insiders believe the industry should place its focus, believing shale gas will be available at a reasonable cost for the next 20 years.
Please rate how significant an impact you believe each of the following will make on the industry on a scale of 1 to 5 (where 5 indicates “significant impact”).
See “Business & Technology Drivers” within full survey results (page 17) for additional information.
New this year was a series of questions regarding energy storage technologies and their utility-scale implementation plans. Other than pumped hydro, energy storage has not been a significant part of utility-scale generating systems. New storage technologies are emerging to take their place in utility systems that have variable and dispersed loads, intermittent solar and wind generation sources and increasing power quality and security concerns.
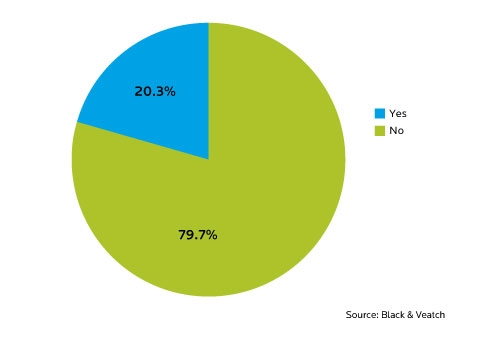
A significant number of survey respondents (approximately 20 percent) are planning utility-scale storage. As Black & Veatch’s Bill Roush and Ryan Pletka observe in their analysis within the Renewable Energy section of the survey (see page 49 of full survey results), 20 percent is a higher percentage than what is typical for early adopters, potentially indicating energy storage is already moving into a more mainstream segment.
This correlates with other survey responses where utility respondents indicated energy storage would have an important role within their respective systems beyond the next five year mark (see page 55 of full survey results.
While the industry seems to be gaining acceptance of various energy storage technology, the much discussed Bloom or hydrogen fuel cell technology was ranked last by survey respondents. This indicates the industry is not bullish on fuel cell development.
Do you have plans to implement any energy storage systems at a commercial scale?
Note: The above chart includes the responses of all survey participants and is not included in the full electric utility survey results.
Lack of understanding and funding represent greatest obstacles for smart grid implementation.
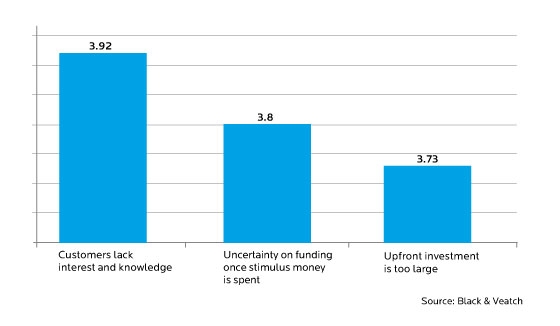
According to all respondents, the greatest impediment to Smart Grid implementation is a lack of customer interest and knowledge. This correlates with additional survey results (see Smart Grid section of full survey results beginning on page 60) that show respondents do not believe Smart Grid programs are well defined within their state or industry. Perhaps exacerbating the
challenge is the fact that more than two-thirds of respondents felt there was a distance between utility and regulator visions for Smart Grid.
Next on the list of greatest impediments to Smart Grid implementation are issues related to money. Uncertainty regarding funding when stimulus funds from the American Recovery and Reinvestment Act are spent and concern for making large, upfront investments were ranked second and third, respectively.
To what degree are the following issues impediments to the implementation of the Smart Grid on a scale of 1 to 5 (where 5 indicates “very large impediment”)?
Note: The above chart includes the responses of all survey participants and is not included in the full electric utility survey results.
Electric vehicles will impact utilities’ annual load over time.
Also new to the 2011 survey are questions regarding electric vehicles and the expected impact this new transportation technology will have on electric utilities. Expanded electrification of ground transportation could represent a sizable new market for electric power, and Black & Veatch wanted to know what utility leaders expect.
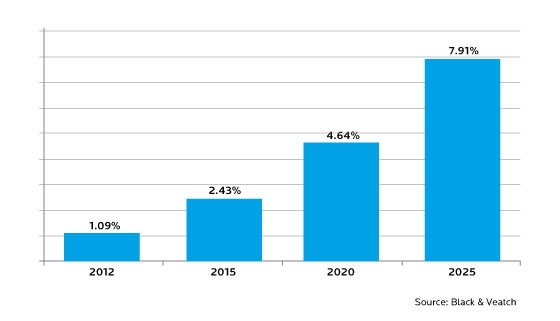
Optimism about electric vehicles was confirmed when respondents provided their estimates on the saturation of electric vehicles in their markets during various future time frames. The chart below depicts the average responses from all survey respondents.
What proportion of your annual energy load do you expect electric vehicles to represent by the end of each of the following years?
Note: The above chart includes the responses of all survey participants and is not included in the full electric utility survey results.
While percentage of overall load may seem small, this is actually a very substantial amount of energy for fueling electric vehicles. The estimate that electric vehicles will account for 1 percent of utilities’ annual load in 2012 equates to approximately 5,300 megawatts of baseload electric generation – the equivalent to power more than 5 million homes.
The United States’ competitive position in the renewable energy technology market is at risk.
This year, Black & Veatch asked utilities – for the first time – about global competition, views on the U.S. power industry’s capability to compete with offshore suppliers and decisions related to purchasing equipment or technology from offshore suppliers.
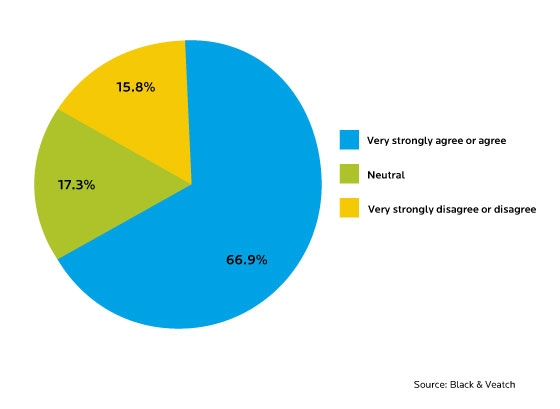
Please rate how strongly you agree with the following statement: “The United States is at risk of losing its domestic design and construction skills, equipment manufacturing capabilities and global competitive position in utility technology.”
Note: The above chart includes the responses of all survey participants and is not included in the full electric utility survey results.
More than 65 percent of respondents believe that the United States is at risk of losing its domestic design and construction skills, equipment manufacturing capacities and global competitive position in utility technology, which is consistent with other questions regarding global competition (see page 74 of full survey results).
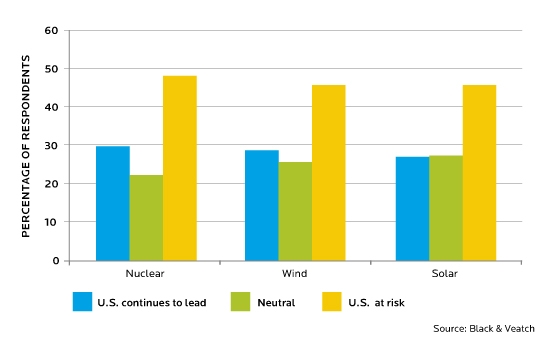
Please rate your perception of the United States’ competitiveness to global competitors for the following technologies.
Note: The above chart includes the responses of all survey participants and is not included in the full electric utility survey results.
Responses to the question above suggest U.S. solar, nuclear and wind industries are at some risk of losing their competitive positions. Two of the three – wind and nuclear – already are dominated by offshore entities.
In the wind sector, General Electric is the only company with U.S. ownership that is ranked in the top ten, based on installed capacity. For nuclear, while some of the reactor technology providers may have familiar names, once again with the exception of General Electric, they are owned by Japanese or French companies. Additionally, General Electric’s nuclear entity is now a joint venture with the Japanese firm Hitachi.
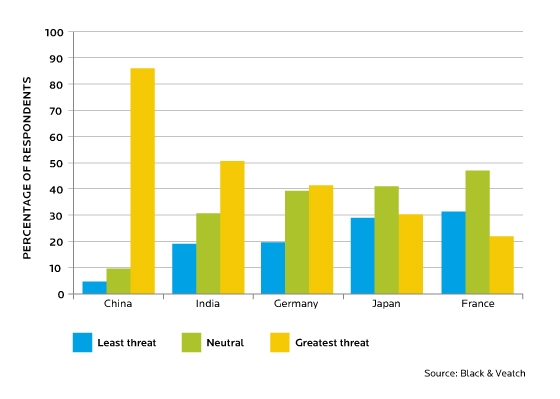
Participants were asked to rate on a scale of 1 to 5, (with 5 signifying the greatest threat) countries they viewed as the greatest threat to United States’ competitiveness. The vast majority of respondents (86 percent) rated China as either a 4 or a 5.
How would you rate each of the following countries as an overall competitive threat to the U.S. energy industry?
Note: The above chart includes the responses of all survey participants and is not included in the full electric utility survey results.

