This morning, the Bureau of Labor Statistics released its updates to the Consumer Price Index. Or, if you prefer English, here’s how prices for various things have changed over the course of the year.
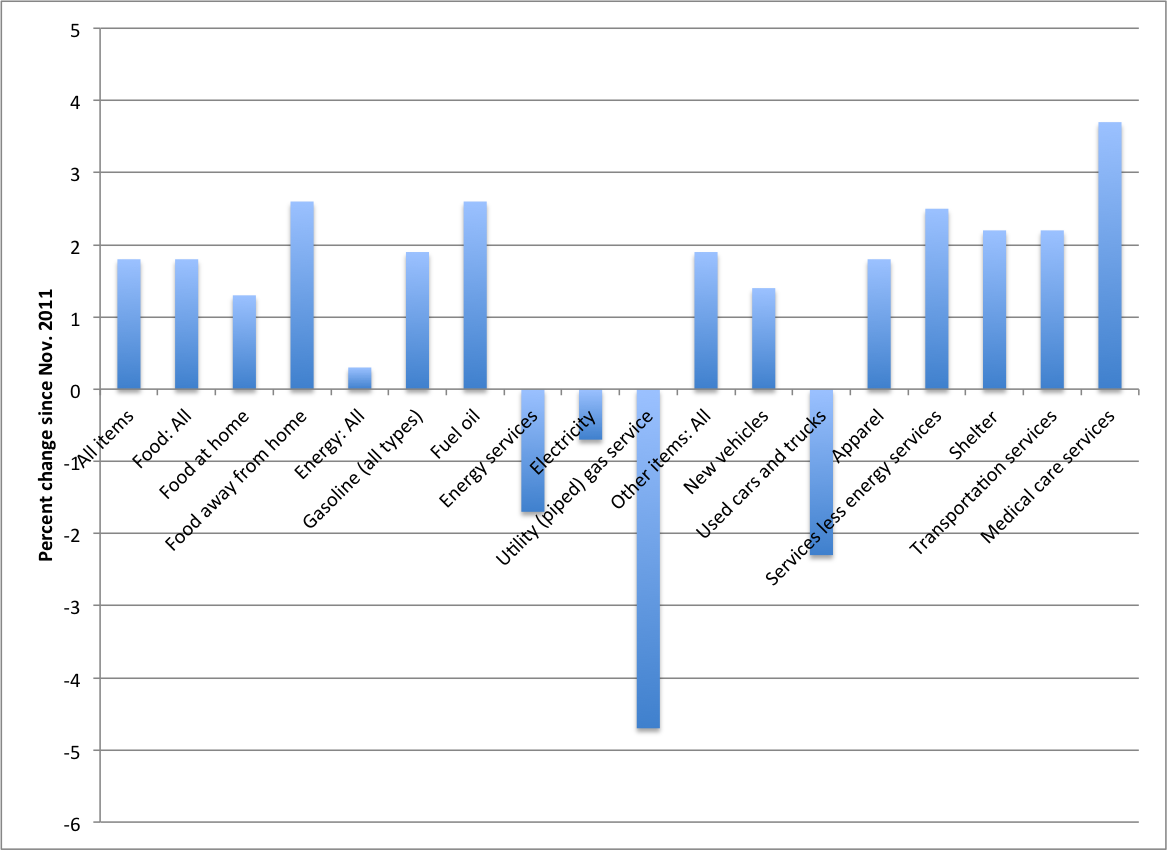
Prices for consumer products rose 1.8 percent over the last 12 months. This continues to be under the 2011 average inflation rate of 3.2 percent. So that’s good! Here’s how individual consumer products performed, year-over-year change, in percentage:

This is really the picture of the American economy. That bar that drops far below the midline? That’s “piped gas” — in other words, natural gas. To the far right, the highest increase was in medical services. Sounds about right.
Different categories performed differently over the past six months. Here’s a comparison of all items with categories: food, energy, and everything else.
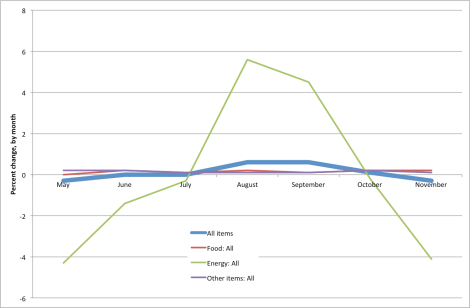
Energy prices were far more volatile than other prices. That category is broken into various subcategories as noted above.
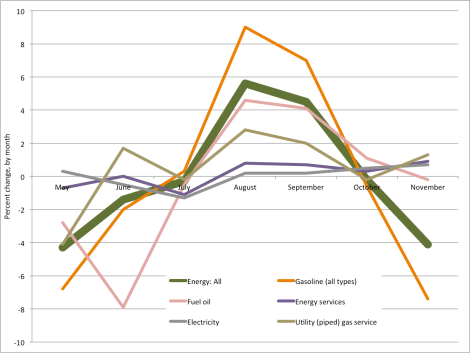
Gasoline is the most volatile of the volatile category — but this shouldn’t surprise you either. Here’s how gasoline has performed in price per gallon nationally over the last six months.
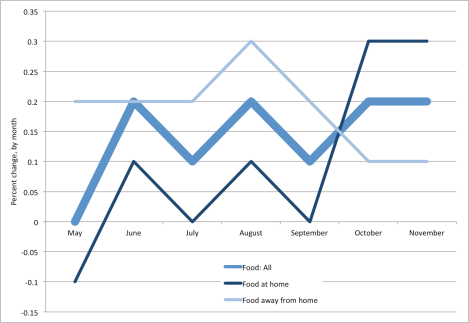
It’s also interesting to note how much less volatile food prices were, given the drought. Prices went up 10 percent in July — but that was globally. Within the United States, both for dining out and at home, prices were pretty flat. (Notice the scale on the left axis below; price changes were only about a quarter of a percent.)
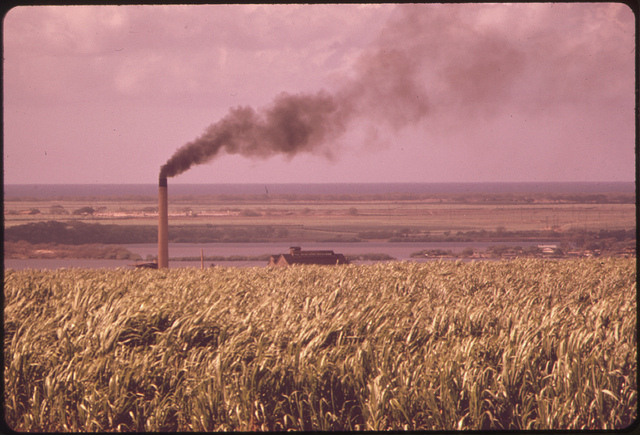
Consider this the government’s year in review (though that will really come when December’s data is released in January). The story it tells is the one we’ve been telling all year: The biggest shifts in our economy are due to changes in our energy use.
A message from
Your support keeps our climate news free.
Grist is the only award-winning newsroom focused on exploring equitable solutions to climate change. It’s vital reporting made entirely possible by loyal readers like you.
At Grist, we don’t believe in paywalls. Instead, we rely on our readers to pitch in what they can so that we can continue bringing you our solution-based climate news. Donate today to keep our site free.