Take a gander at this map of the United States lit up like the burning face of the sun. It shows how hot America got from July 10-19, with maximum temperatures shown in appropriately incendiary shades:
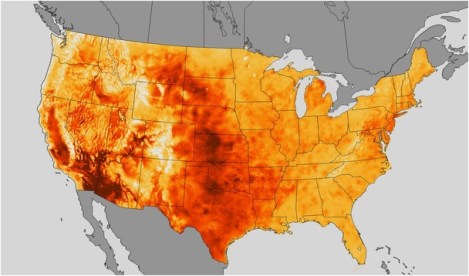

Released on Friday by NOAA, the map shows the hellish days that preceded the nation’s current meteorological bugbear: an “oppressively hot area of high pressure,” to use the National Weather Service’s language, that’s now making eyeballs sweat on the East Coast. How nasty is it there? Here are a few indicators:
- So many people were camped in front of their A/Cs on Friday that New York’s power grid reached an all-time usage high. Reports Reuters: “The New York Independent System Operator (NYISO) forecast consumer demand use peaked at 33,955 megawatts on Friday, up from 33,450 MW on Thursday, breaking the state’s all-time record of 33,939 MW set in 2006.” To use the words of a woman in New York City, where the mercury hit 99, “It feels like I’m living inside of a dog’s mouth.”
- New Yorkers apparently want away from the scalding weather so badly that they destroyed a JetBlue promotion offering discounted tickets out of the city’s airports. After complaining of “intermittent issues” in redeeming customers’ purchases this week, the airline company issued a statement saying its “systems just weren’t able to manage the volume of New Yorkers looking to beat the heat.”
- More than 50 firefighters attacking a multiple-building blaze in Jersey City were treated at the scene or the hospital for heat-related reasons.
- Friday saw a new record high in Boston of 99 degrees. Nearby, the Plymouth nuclear plant was forced to cut its power output by 15 percent because the waters off Cape Cod Bay were too warm to cool the reactor, the AP reports.
- People have died of heat-related causes in Philadelphia, Milwaukee, Staten Island, Baltimore County, Centuria, Wis., and elsewhere.
 On that last topic, American cities could see many more hot-weather fatalities in the decades to come. That’s because the changing climate is expected to drive more frequent and longer heat waves across the land, according to a researcher from the National Climatic Data Center.
Right now, the United States incurs an average of 658 heat-related deaths each year, to judge from mortality data from 1999 to 2009. (Interesting side note: The majority of people passing away from heat tend to be male, much like fatalities from lightning strikes.) But the Natural Resources Defense Council, an international environmental-activism group, predicts that death toll will shoot up as more and more carbon enters the atmosphere.
In a report [PDF] released last summer, the NRDC warned that up to 150,000 people could perish by the end of the 21st century — averaged out, about 1,700 per year — due to afflictions caused or worsened by torrid weather like heat stroke, heat exhaustion, and heart and kidney diseases. And that only includes the country’s 40 biggest cities, according to the group’s analysis, which was based on peer-reviewed studies in the journals Weather, Climate, and Society and Natural Hazards.
Here are a few of the enhanced death numbers the NRDC sees going down in cities by 2099:
- Louisville, Ky.: 19,000 deaths
- Detroit: 17,900
- Cleveland: 16,600
- Memphis: 10,200
- Jacksonville, Fla.: 8,100
- Minneapolis: 7,500
- Dallas: 7,300
- Chicago: 6,400
- Boston: 5,700
- St. Louis: 5,600
- Columbus, Ohio: 6,000
- Kansas City, Mo.: 4,200
- Denver: 3,500
- Washington, D.C.: 3,000
 This story was produced by Atlantic Cities as part of the Climate Desk collaboration.
A message from
Your support keeps our climate news free.
Grist is the only award-winning newsroom focused on exploring equitable solutions to climate change. It’s vital reporting made entirely possible by loyal readers like you.
At Grist, we don’t believe in paywalls. Instead, we rely on our readers to pitch in what they can so that we can continue bringing you our solution-based climate news. Donate today to keep our site free. All donations DOUBLED for a limited time.