With autumn upon us, the outrageous extremes of heat we’ve been enjoying will only be outrageous extremes in the context of the time of year. Which is kind of sad for those of us who like to sit and watch the thermometer all summer, looking to see when the mercury crests over the most recent high, like marking a kid’s height in a door frame. Our little climate’s growing up / becoming a living horror scene.

Old and busted.
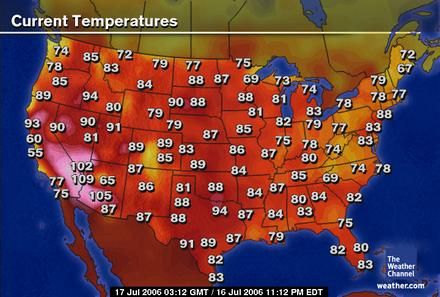
Each month, the National Oceanic and Atmospheric Administration cobbles together a helpful compendium of all of the ways that the previous month’s weather was horrible. It just released the data for September. Turns out we’ve had the hottest “warm season” — April-to-September stretch — in U.S. history, and the year so far has been the warmest ever.
Other highlights, such as they are:
- The average contiguous U.S. temperature during September was 67.0°F, 1.4°F above the 20th century average, tying September 1980 as the 23rd warmest such month on record. September 2012 marks the 16th consecutive month with above-average temperatures for the Lower 48.
- According to the October 2, 2012 U.S. Drought Monitor, 64.6 percent of the contiguous U.S. was experiencing moderate-to-exceptional drought, slightly larger than the extent of drought at the end of August. The percent area of the nation experiencing exceptional drought, the worst category of drought, remained nearly constant at about 6 percent.
- The contiguous U.S. warm season, defined as the six-month period from April-September, had temperatures that were record warm. The six-month average temperature of 68.2°F for the Lower 48 was 2.6°F above average.
- The January-September period was the warmest first nine months of any year on record for the contiguous United States. The national temperature of 59.8°F was 3.8°F above the 20th century average, and 1.2°F above the previous record warm January-September of 2006. During the nine-month period, 46 states had temperatures among their ten warmest, with 25 states being record warm. Only Washington had statewide temperatures near average for the period.
It’s worth also looking at the list of temperature anomalies, year-to-date. It will take a while to scroll down.

Shutterstock New hotness.
The Capitol Weather Gang, a great blog from the Washington Post, noted another NOAA study that looked at how Arctic ice loss will affect the weather in North America:
[D]eclining Arctic sea ice may be playing a role in … extreme, fluctuating weather patterns, which may assert themselves even more in the coming decades.
Published today, the study provides evidence that high altitude winds that separate cold air from warm air have become more wavy and meandering in recent years. Instead of moving right along from west to east, they have tended to plunge south and surge north.
This change, the authors suggest, may be playing a role in atypically warm and cold weather extending unusually far north and south at different times, and then staying put. …
“This shift demonstrates a physical connection between reduced Arctic sea ice in the summer, loss of Greenland ice, and potentially, weather in North American and Europe,” said James Overland, of NOAA’s Pacific Marine Environmental Laboratory and study lead author.
This reinforces findings from earlier this year that Arctic ice melt might foreshadow a cold, harsh winter.
And, frankly, I’m excited about it! I get to spend all winter staring at the thermometer, watching the mercury drop and marking each time it hits a new low, like marking Benjamin Button’s height in a door frame.


