It’s extremely likely that humans have been the dominant cause of global warming since the 1950s, according to a landmark report from the world’s top panel of climate scientists. And we’re failing in our efforts to keep atmospheric warming below 2 degrees Celsius, or 3.6 Fahrenheit, which many scientists say is needed to avoid massive disruption.
The Intergovernmental Panel on Climate Change conducted an epic review of climate research over the last three years. It is summarizing the most important findings in its fifth assessment report, which offers the clearest picture science has ever painted of how humans are reshaping the climate and the planet.
Here, in a nutshell, are the main findings of a summary [PDF] of part one of the assessment report, which focuses on the science of climate change:
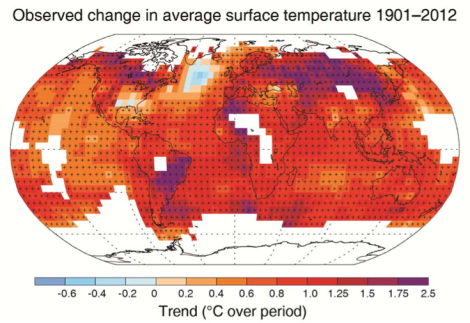
Human influence has been detected in warming of the atmosphere and the ocean, in changes in the global water cycle, in reductions in snow and ice, in global mean sea level rise, and in changes in some climate extremes. …
Warming of the climate system is unequivocal, and since the 1950s, many of the observed changes are unprecedented over decades to millennia.
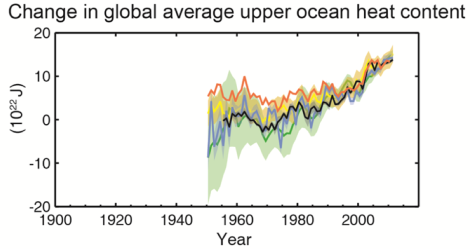
The IPCC also concludes that oceans have absorbed more of Earth’s excess heat since the 1990s than was the case during prior periods, explaining what climate deniers wrongly describe as a warming slowdown. And the panel revised downward the lower limit of warming that’s expected once we double the atmosphere’s CO2 concentrations, but left the upper limit unchanged from its 2007 assessment.
For background on the IPCC and this assessment report, be sure to check out this explainer.
And to save you the trouble of reading the dense 36-page summary released on Friday, we’ve rounded up highlights here — key numbers, facts, and graphs:
Carbon emissions
1 trillion tons: That’s the amount of carbon dioxide we could release into the atmosphere while keeping global warming under 3.6 degrees Fahrenheit.
We’ve already released more than half that amount, mostly by burning fossil fuels and producing concrete, but also by tearing out forests and other ecosystems. A scientist involved with the study told The New York Times we will hit the limit in 2040 unless serious steps are taken to reduce carbon emissions.
Land temperatures
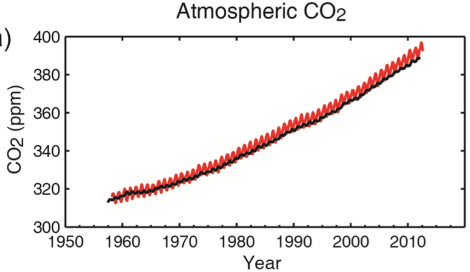
2.7 to 8.1 degrees Fahrenheit (1.5 to 4.5 Celsius): That’s the “likely” range of temperature rise once CO2 levels double in the atmosphere to 560 parts per million. The level was 280 ppm in pre-industrial times, and recently rose above 400 ppm.
Although it’s “virtually certain” that there will be more extremely hot days and fewer extremely cold ones, occasional cold winter extremes will still occur.
Ocean temperatures
0.2 degrees Fahrenheit (0.1 Celsius): That’s the rate at which the upper 250 feet of the oceans are warming every decade.
More than 90 percent of Earth’s extra heat is being absorbed by the oceans, where it’s affecting currents and causing water to expand, contributing to rising seas.
Sea levels
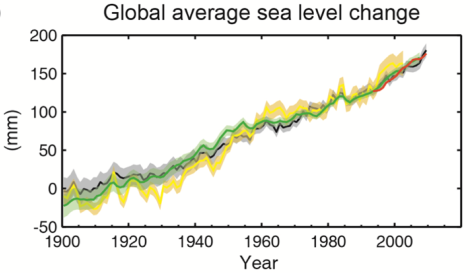
1/8th of an inch (3.2 mm): That’s the annual rate at which seas have been rising since 1993.
The two main contributors to the rising seas are melting glaciers and warming waters, which expand as they heat up.
Ocean acidification
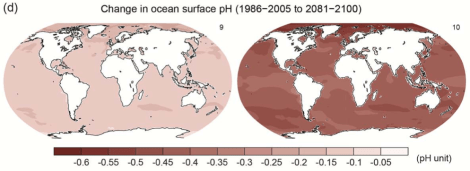
26 percent: That’s the increase in hydrogen ion concentration at the surface of the world’s oceans since the Industrial Revolution, corresponding to a pH decrease of 0.1.
Oceans have absorbed about 30 percent of the CO2 that we have released into the atmosphere, and that’s what has caused the rise in acidity.
Rain, snow, and hail
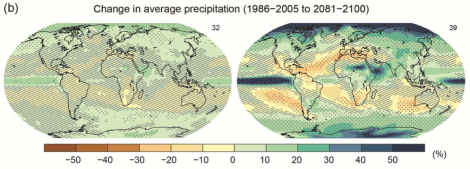
It is “likely” that the number of regions where heavy rains have already become more common is greater than the number of regions where heavy rains are now occurring less frequently.
The contrast between wet and dry regions will continue to increase, with wet areas getting wetter and dry regions growing more parched. Similarly, the contrast between wet and dry seasons will also become more pronounced.
Snow cover
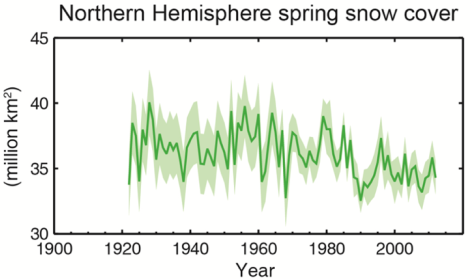
11.7 percent: That’s the reduction in the extent of June snow cover every decade in the Northern Hemisphere between 1967 and 2012.
Snowfall rates are expected to increase over Greenland and Antarctica. In Greenland, scientists have “high confidence” that snowfall will increase too slowly to make up for faster melting rates, though that may not be the case in Antarctica.
Ice
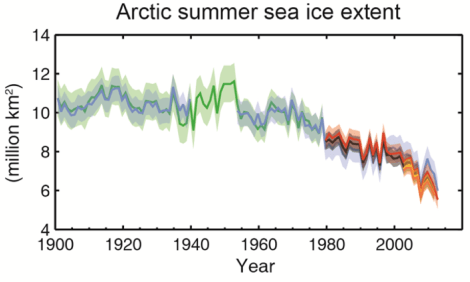
303 billion tons: That’s the amount of ice that the world’s glaciers have lost every year since 1993.
The speed with which Greenland’s ice sheet is melting has increased substantially — 237 billion tons of ice were lost yearly from 2002 to 2011, up from 37 billion tons per year from 1992 to 2001. Meanwhile, Antarctica lost 162 billion tons of ice per year from 2002 to 2011, up from 33 billion tons annually from 1992 to 2001.

