This story was co-published with WBUR.
As heavy rain drenched Barre, Vermont, last month, Kim Beinin was watching Thor with her two young children. About halfway through the movie, she peeked out the window and was startled to see water flowing over the road and into her neighbor’s driveway. Knowing her home was surely next, she gathered her children and fled.
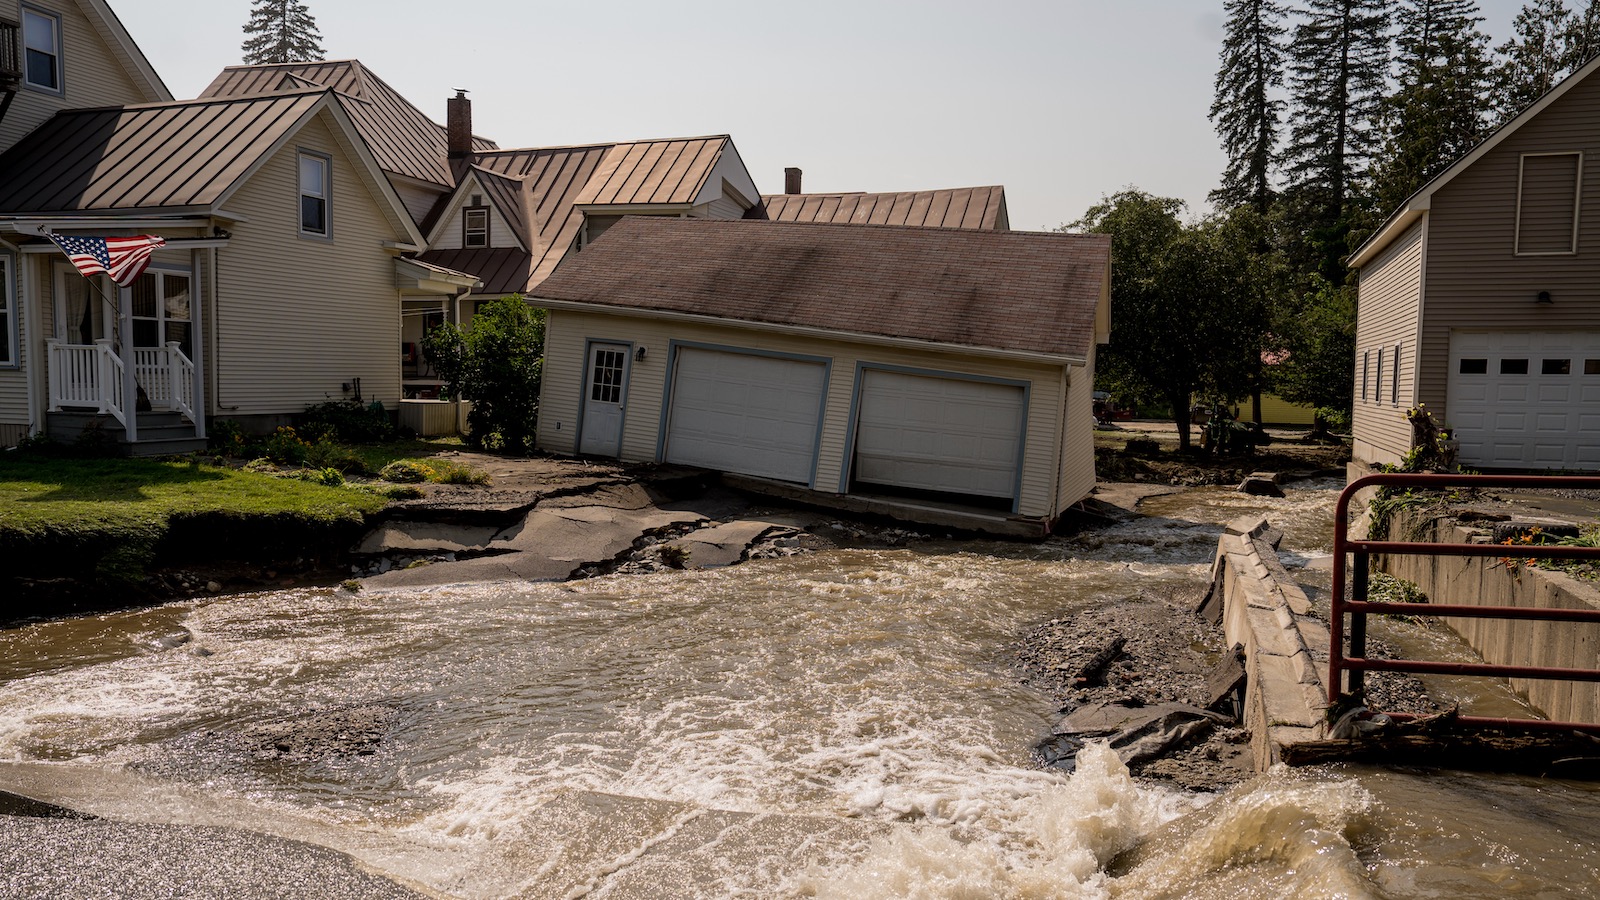
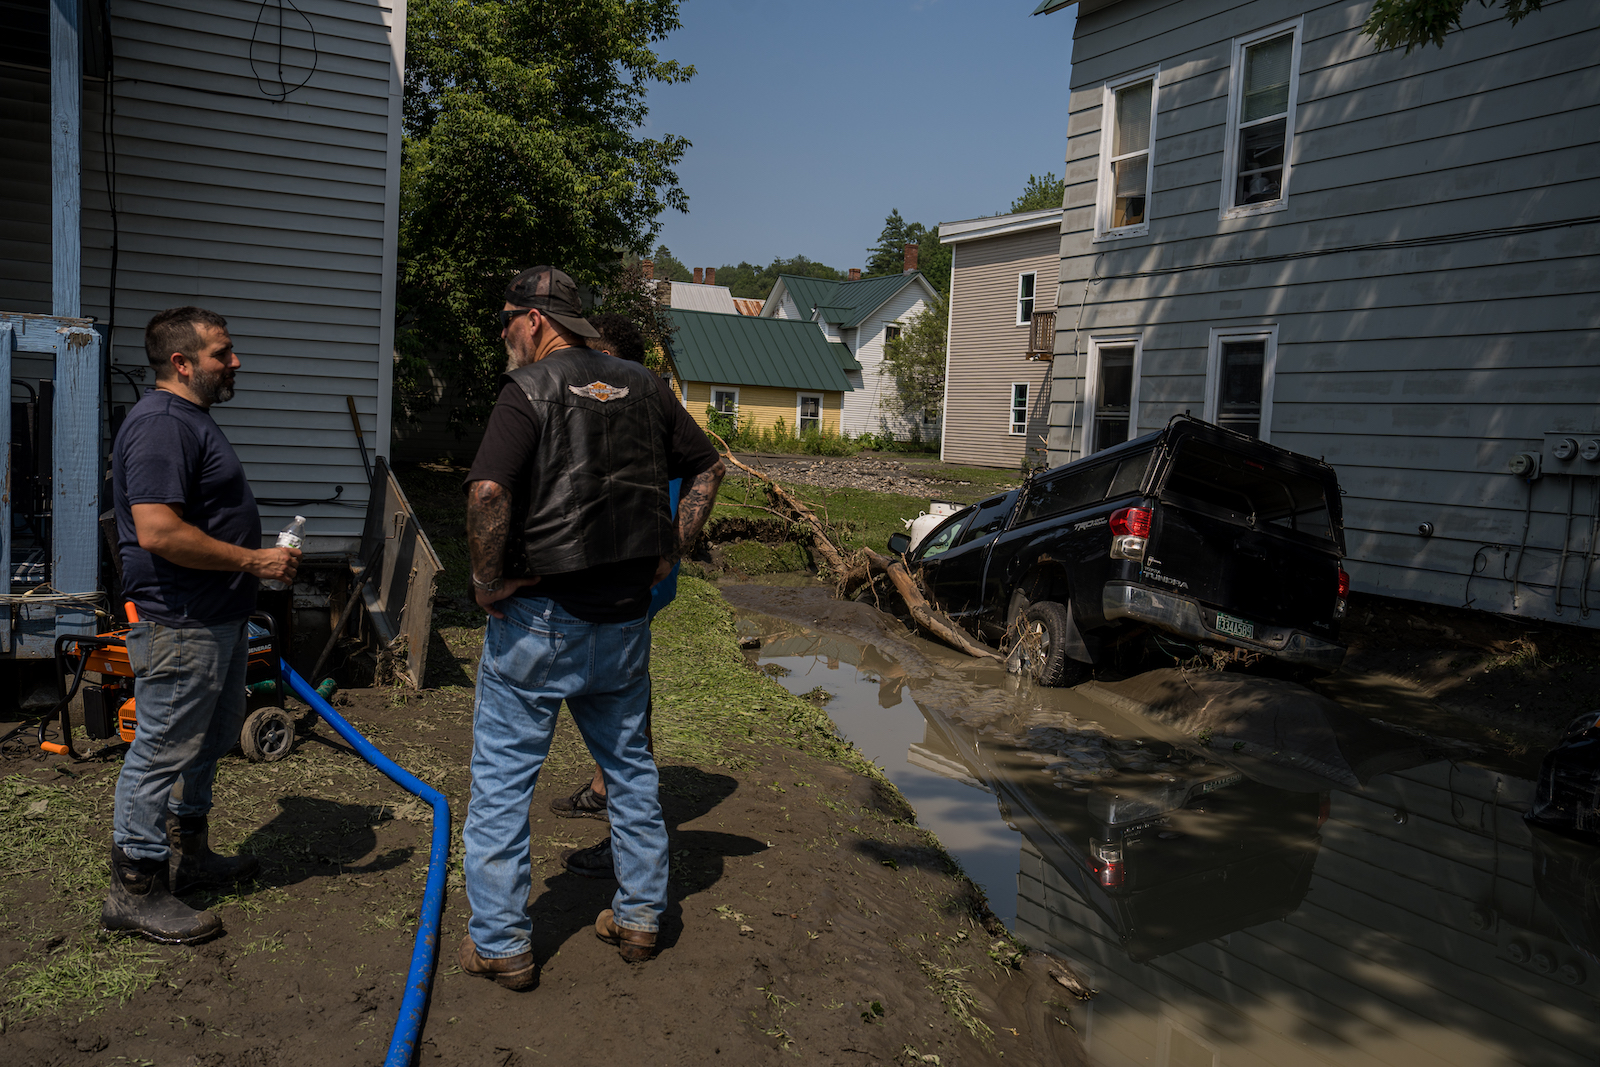
When the rain stopped two days later, she returned to find her basement submerged in 5 feet of water. The heating oil tank lay on its side, the water heater was flooded, and the electrical panel had cut out, leaving the house without power.
“It was horrific,” she said. “My contractor was like, ‘I cannot believe your garage is still standing.’” The shock of seeing her house waterlogged was made worse by the fact that Beinin felt blindsided. “I was told I wasn’t in a flood zone.”
The most common reference for flood risk are the flood insurance rate maps, also known as 100-year floodplain maps, that the Federal Emergency Management Agency, or FEMA, produces. They designate so-called special flood hazard areas that have a roughly 1 percent chance of inundation in any given year. Properties within those zones are subject to more stringent building codes and regulations that, among other things, require anyone with a government-backed mortgage to carry flood insurance.
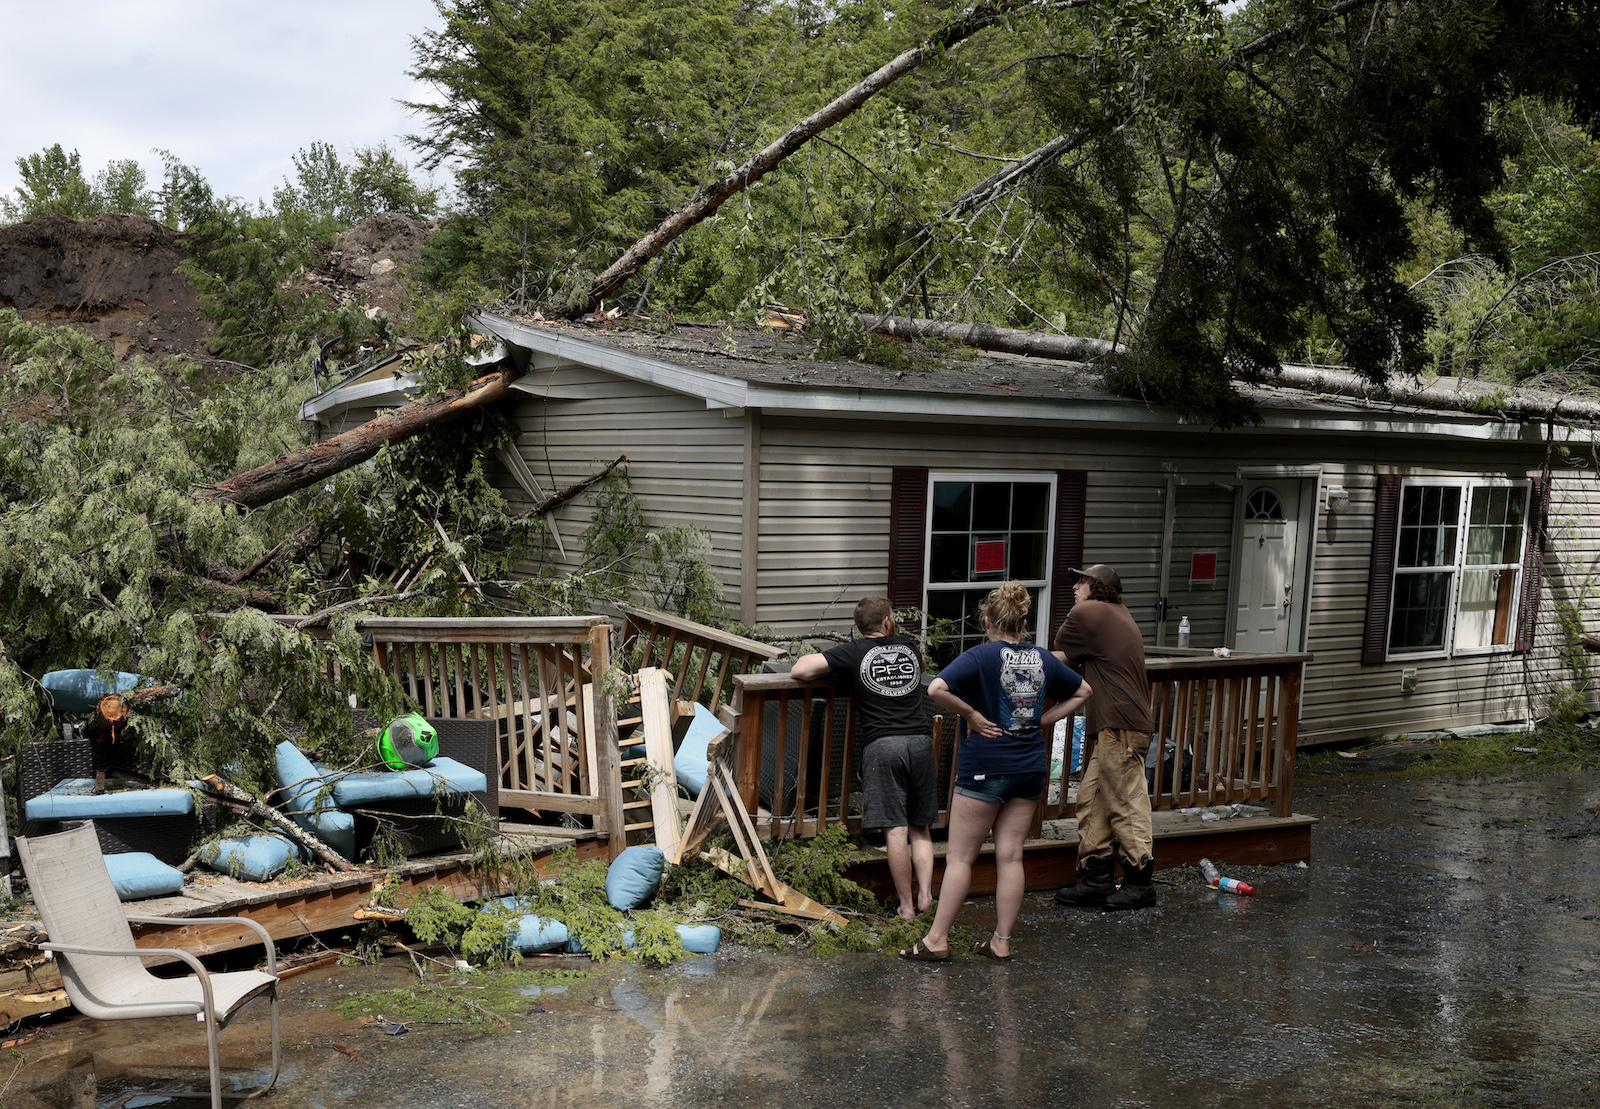
The property information report that sellers include with most home sales in Vermont indicates whether a property is in a flood zone. But Beinin says she received no such warning because FEMA indicated that the house she bought in 2021 was well outside a high-risk area. Yet the entire area was walloped. The torrent washed away her neighbor’s driveway and left their garage broken, tilted, and cracked. A red “DANGER UNSAFE” poster remains plastered on the front of it.
Although the federal maps “can help communicate risk,” they’re often incomplete or outdated and don’t adequately reflect the threat, especially as the climate changes, said Chad Berginnis. He is the executive director of the nonprofit Association of State Floodplain Managers and also a member of FEMA’s National Advisory Council. Other experts echoed his opinion that FEMA’s assessments “are a good place to start but should never be the end point in knowing flood risk.”
When the nonprofit climate research firm First Street Foundation compared its flood model to FEMA’s maps, the report found that as of 2020 5.9 million properties and property owners are currently unaware of or are underestimating the risk they face, because they are not identified as being within the special flood hazard areas zone. The small creek running past Beinin’s home wasn’t shown as flood-prone on the federal map, but First Street’s model included it and rated the property an “extreme flood risk.” Had she known that, she said, “I either would have gotten flood insurance or maybe not bought the house.”
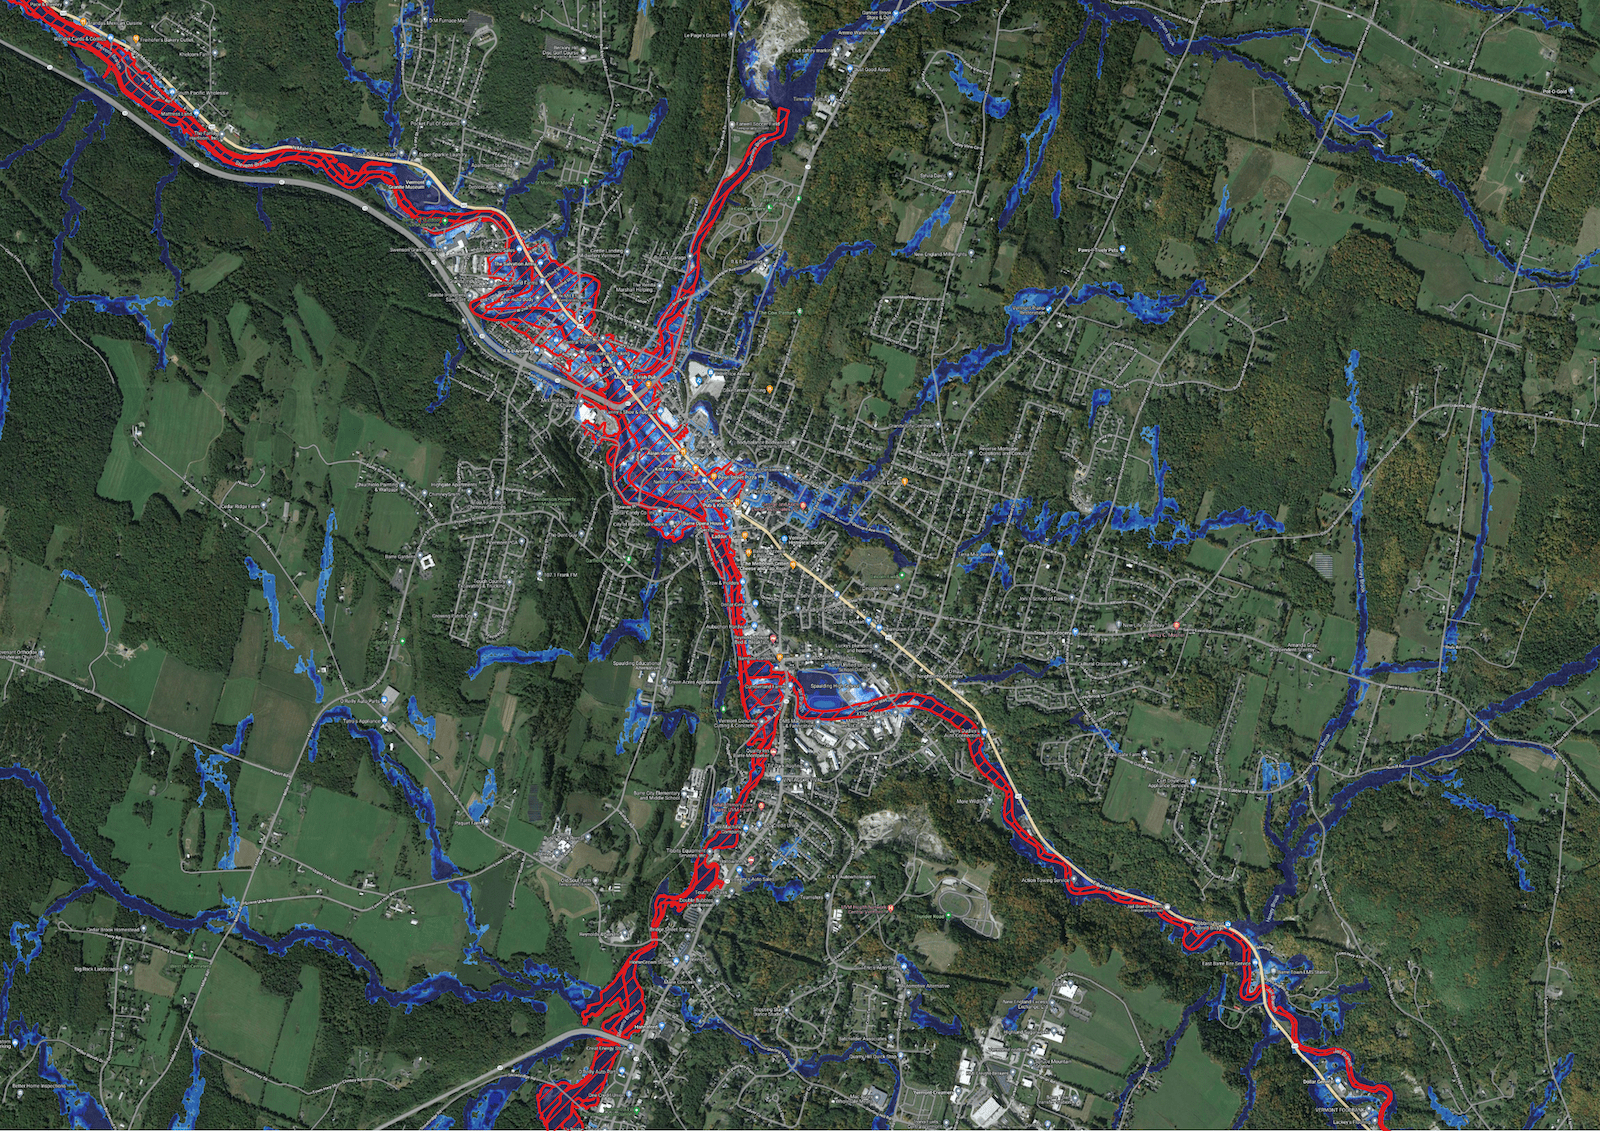
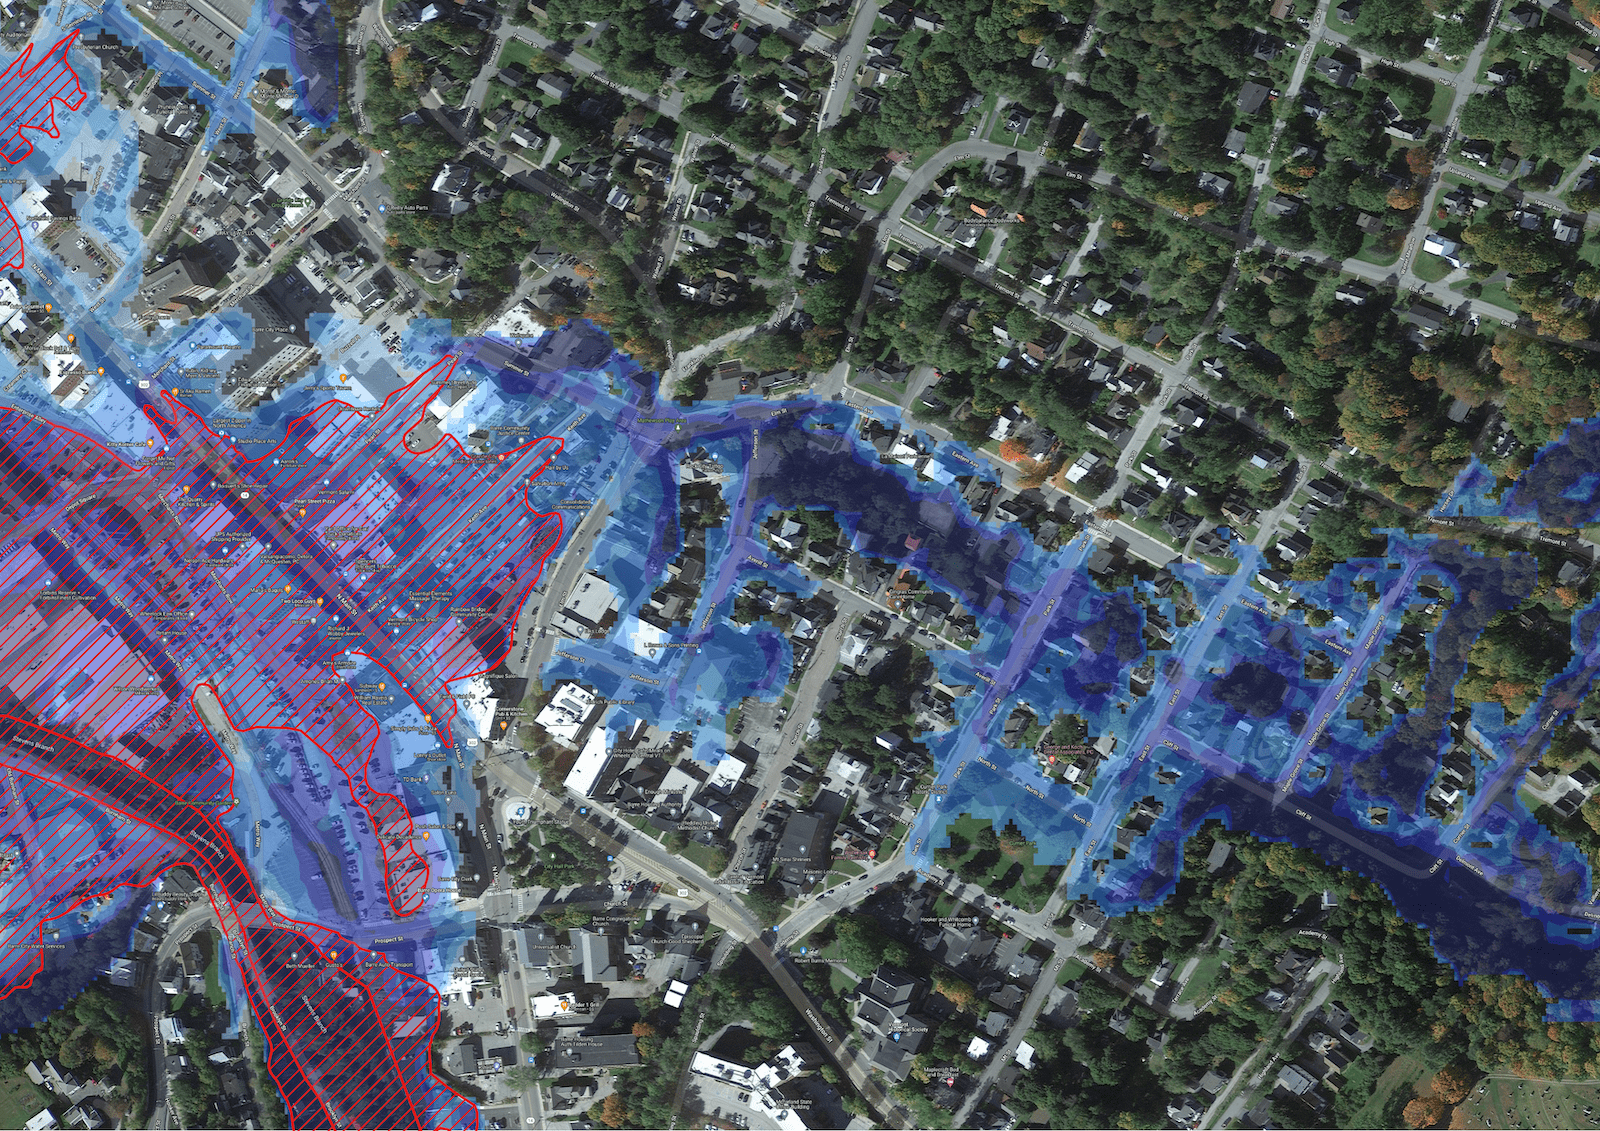
Satellite maps of Barre, Vermont, show FEMA’s 100-year-flood zone in red. First street Foundation’s analysis found a much larger 100-year-flood zone, as marked in blue. First Street Foundation
According to FEMA, its maps aren’t meant to predict where a flood might occur, or even where they have occurred in the past. Rather, they are “snapshots in time of risk” that are used for flood insurance determinations and managing development in floodplains.
“The flood maps are minimums. They are not a comprehensive understanding of all the flood hazards and flood risks,” said Luis Rodriguez, director of the agency’s engineering and modeling division. “Where it can rain, it can flood.”
But Berginnis says that narrow view reflects a bit of wishful thinking. “Because it is the big national dataset for flood mapping, the way the public often perceives the maps is that they’re the end-all, be-all of flood risk,” he said. “That sort of comes with the territory.”
Regardless, people in FEMA’s blindspots are pummeled at an alarming rate. After Hurricane Harvey hit the Gulf Coast of Texas in 2017, the Harris County Flood Control District, which includes the city of Houston, found that half of the 204,000 homes that flooded were outside the federal hazard zone. According to FEMA, 40 percent of claims made through its National Flood Insurance Program come from people beyond the 100-year floodplain.
Cambridge, about an hour from Barre, is another area of Vermont where FEMA maps failed to adequately capture the risks residents face.
“I would say the FEMA maps are grossly outdated,” said Jonathan DeLaBruere, the town administrator. Cambridge’s map isn’t even fully digitized, so he has a scan pulled up on his computer and pointed to the date in the corner: 1983.
The high-risk floodplain is marked in gray and weaves up from the Lamoille River toward Main Street. A handful of properties are included in FEMA’s 100-year floodplain, but most aren’t. Regardless of their designation, almost all of the buildings have flooded multiple times in the last century.
Pearl Dennis bought her house, which isn’t in a FEMA hazard area, in 2015. It only took a few years before flood waters reached her front steps. “We tried to get flood insurance after the 2019 flood,” she said. “We were denied because we were too far away from the river.”
FEMA said it cannot comment on specific cases for privacy reasons, but in an email to Grist an agency spokesperson said the distance to a river or other body of water does not impact federal flood insurance eligibility. He also said National Flood Insurance Program policies are available for “any eligible building” in a community that participates in the program, as both Barre and Cambridge do.
This month’s storm sent the Lamoille raging through the first floor of Dennis’ house, flooding her basement and backyard along the way. Hay bales weighing 600 pounds floated over from a neighbor’s farm and still sit on the lawn. Her floorboards are peeling, and the street is piled with ruined appliances, belongings, and debris.
Similar stories and sights abound on the block, even though large swaths of the waterlogged street lie in an area that FEMA says should flood less than every 500 years.
“The word ‘flood’ never came up at all until July 10,” said Erica Hayes, whose parents bought the Cambridge Market Village earlier this year. Then they saw 9 feet of water inundate their basement. While First Street pegged the store as a “moderate” flood risk, FEMA does not include it in its hazard area.
“If we were in a flood zone, we probably wouldn’t have bought,” said Hayes. The store didn’t have flood insurance, because it wasn’t mandatory and the cost proved prohibitive. Hayes pegs the damage at roughly a quarter million dollars.
“We have to cover it out of pocket,” she said. “But there’s no pocket to pay out of.”
One of the problems Berginnis noted is that FEMA has mapped only about a third of the nation’s streams, rivers, and coastlines.There are other faults as well. Many maps are decades out of date, despite a statutory requirement that FEMA review them every five years. They also do not capture urban stormwater flooding caused by intense rain — events that Berginnis say are becoming more frequent and intense.
That points to what may be the biggest shortcoming of all: The maps don’t account for climate change, because they rely on historical rather than forecasted data. In 2012, Congress told FEMA to incorporate future conditions such as sea-level rise, but more than a decade later, that hasn’t happened.
“If FEMA did what Congress directed it to do, it would probably smooth out a lot of things,” said Rob Moore, the director of the Water & Climate Team at the Natural Resources Defense Council.
The delay in integrating climate data stems in part from the Trump administration, said FEMA spokesperson Jeremy Edwards. “Under the previous administration, climate resilience was not a priority,” he said, which limited what could be done. Now, he said, it’s a top concern. The agency is “working toward” incorporating future conditions into its maps, especially sea-level rise, Rodriguez said. That data should be available by the end of the 2025 fiscal year.
But inland flood risk is more challenging to model, Rodriguez said, and the science “is just not evolved enough to be able to credibly provide information around future conditions.” More broadly, FEMA’s Future of Flood Risk Data initiative aims to adopt a graduated analysis of risk rather than the binary “in” or “out” approach that currently exists with regard to flood zones.
In the meantime, Rodiquez says roughly 84 percent of FEMA’s maps are “current and updated,” which exceeds the agency’s goal of 80 percent. As for the remaining areas, he said, “resources are certainly a consideration. We have to prioritize.” The focus has been on those areas at highest risk, often places with large populations. But, he added, “communities can make requests to FEMA to update that flood hazard information“ at any time.
While the maps are lagging behind, FEMA has in recent years modernized its model for setting insurance rates. The revamped system, called Risk Rating 2.0, uses many inputs in addition to maps, including private data from contractors such as CoreLogic and Atkins. But this more accurate assessment of risk is only accessible through an insurance company or agent.
First Street has made its model publicly available at riskfactor.com, where anyone can type in an address and receive user-friendly risk information for any property in the U.S. Redfin and Realtor.com have also incorporated the data. It tries to improve on FEMA’s work by, among other things, covering the entire country, taking climate change into account, and incorporating rain and other precipitation hazards.
Many states and municipalities have undertaken their own mapping efforts. Since 2000, Mecklenburg County and the city of Charlotte, North Carolina, have been including current and future floodplains on its official maps. The Harris County Flood District has worked with FEMA to update its maps, which when released later this year will be the first in the nation to incorporate urban stormwater flooding.
“This update is really a transformational way of thinking about floodplains,” Tina Petersen, the executive director of the district, told the Houston Chronicle. The size of the floodplain will also increase by about a third.
Vermont’s effort to improve on federal maps began in the early 2000s. “We came to realize that so much of our flood risk is due to flood-related erosion,” said Rob Evans, manager of Vermont’s River Program. “[But] the FEMA maps really don’t capture river dynamics at all.”
The state set out to chart where rivers should, or would, go during a flood. “This is the minimum space the river needs to be least erosive,” Evans explained. Sometimes these so-called ”river corridor” maps overlap with federal flood zones, but often they are significantly more expansive. The state, for instance, captured the potential for flooding on Beinin’s property that FEMA did not.
“We have a number of towns that have adopted river corridors into their zoning,” said Evans, and so has the state. That means river corridors must be taken into account when planning construction and setting building standards.
That said, Vermont maps aren’t as well known or ingrained in policy as FEMA’s (Beinin and other flood victims Grist interviewed didn’t know about them). That’s another reason it’s critical that FEMA finish mapping the whole country, a project Berginnis’ group estimates will cost between $3.2 billion and $11.8 billion.
“When you think about the damages that you might be able to avoid with better mapping,” Berginnis said, “that investment is totally worth it.”
But even the most advanced flood models are still evolving. Landslides, for example, are one hazard that most of them don’t include, said Beverly Wemple, a professor of geography and geosciences at the University of Vermont. A rain-induced landslide tore a home off its foundation not far from Beinin’s house. The same thing happened to another house an hour south in Ripton.
“We don’t have an approach to capturing flood impacts in mountainous terrain,” said Wemple. “They are hugely vulnerable to damage”
Berginnis has seen some signs that federal flood maps may improve in coming years. Last year’s bipartisan infrastructure bill included $492 million to update the National Oceanic and Atmospheric Administration precipitation database that underlays much of FEMA’s work in this area. But he said more can and should be done.
“Why are we so addicted to spending on disaster recovery, rather than investing in disaster prevention?” he asked. “We don’t have that same urgency.“
This story has been updated with additional information from FEMA about National Flood Insurance Program eligibility.