

This post originally appeared on Energy Self-Reliant States, a resource of the Institute for Local Self-Reliance’s New Rules Project.
Adam Browning of Vote Solar wrote about a recent study of the peer pressure effect of solar photovoltaic (PV) adoption. The study [PDF] notes that for every 1 percent increase in the number of installations in a single ZIP code, there’s a commensurate 1 percent decrease in the amount of time until the next solar installation. As he writes, “solar is contagious!”
I’m a data lover, so I thought it would be interesting to see what this looks like over time. If you start with a neighborhood with 25 solar installations, where it was 100 days between the 24th and 25th installation, this peer pressure effect will reduce the time between installations to just 10 days by the 250th PV project.
Of course, this process takes a while to unfold. In fact, if solar PV was being installed only once every 100 days at the outset, the peer pressure effect will take over 15 years to reduce the time between neighborhood installs to 10 days.
The second line on the chart (red) looks at the change if you start with 25 solar installations but with a time between installs of just 30 days. By the 250th PV project, the time between installs has dropped to three days. And because the lag time between installations started so much lower, the 10-fold drop in lag time takes less than five years.
The basic formula — written another way — seems to be that a 10-fold increase in local solar installations will result in a 10-fold drop in the time between installations. This will hold true through the second iteration, as well. In the neighborhood with an initial 100-day lag between installations, it will take another 15 years for the lag to drop to one day from 10 days, reaching this level when there are 2,500 local PV projects installed.
Perhaps I can amend Adam’s statement: solar is contagious, but it’s not yet very virulent.
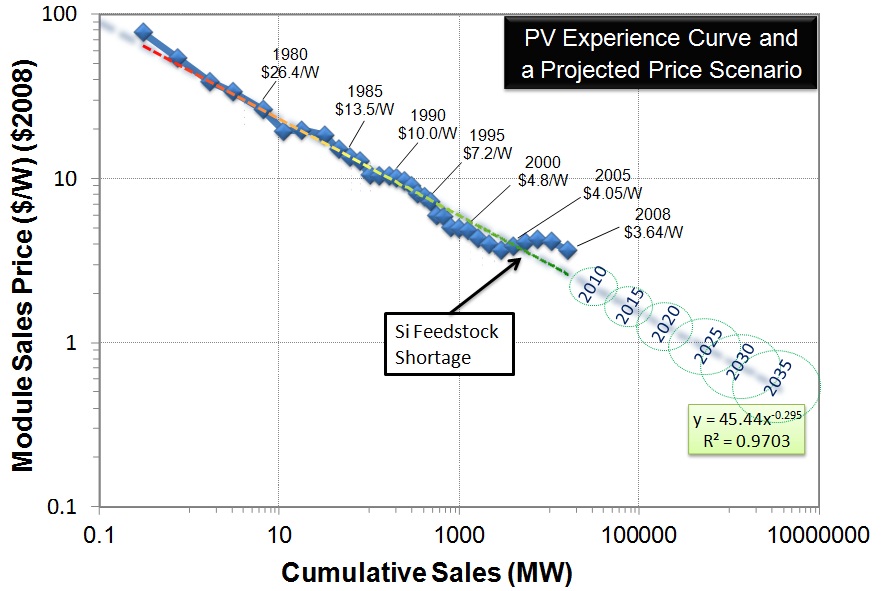
Note: If only the experience cost curve for solar PV worked at the neighborhood level, since it typically shows a halving of installed cost for every 10-fold increase in total installed solar capacity (worldwide)!
