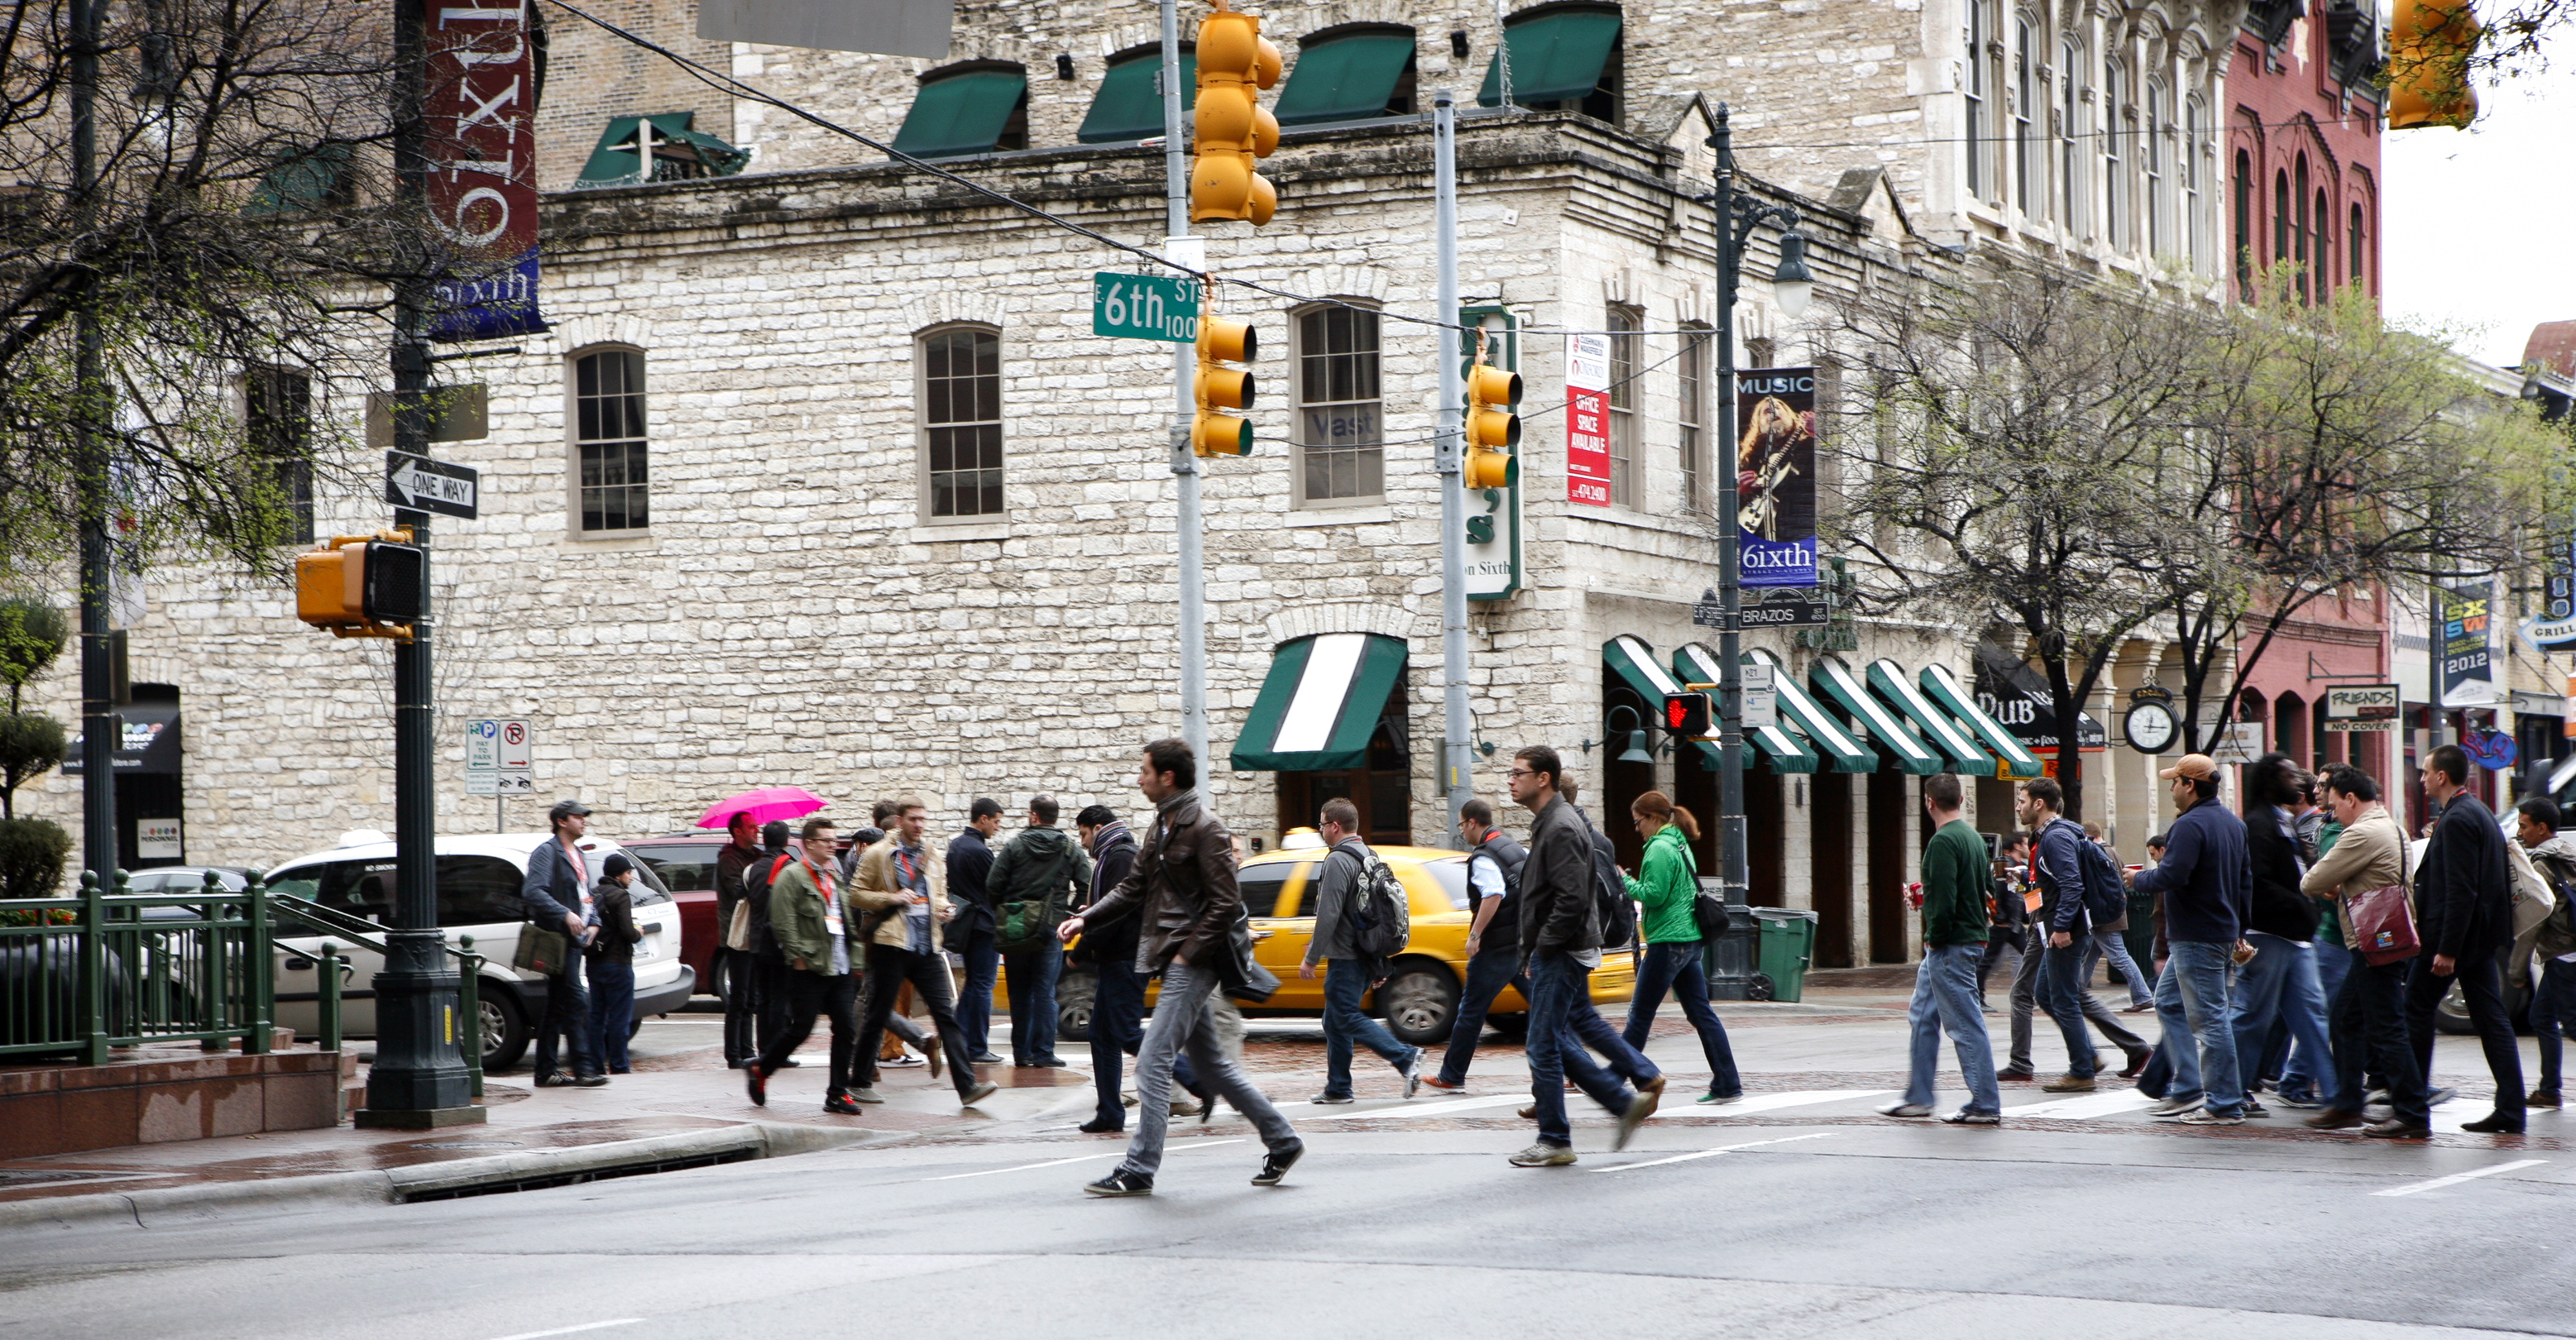
ShutterstockAustin, Texas.
One of the simplest ways to measure our dependence on cars is to look at the share of commuters in a given city who get to work in a private vehicle. These are the people who rely on automobiles as part of their everyday travel patterns. They’re people who live too far from work to walk there, who may prefer not to take transit, or who simply have no other options. They’re the commuters for whom communities must widen highways for rush-hour capacity and build out parking garages for downtown businesses.
Over the last decade, however, a new report from the U.S. PIRG Education Fund and the Frontier Group finds that the share of workers who get to work by private car declined in 99 of America’s 100 largest urbanized areas (by the Census Bureau’s definition, this is a densely populated geography often larger than a single city but smaller than a metropolitan area). The lone outlier was New Orleans, which has been an outlier in many ways since Hurricane Katrina.
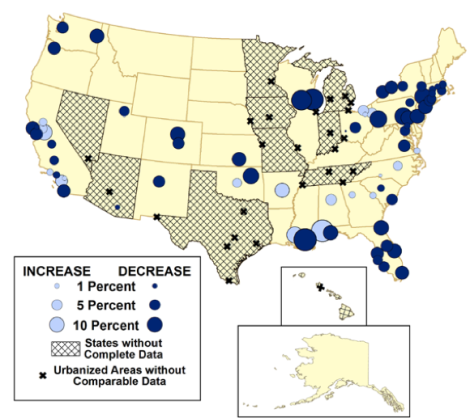
Benjamin Davis and Phineas Baxandall calculated this using “journey to work” data from the 2007-2011 American Community Survey, comparing it to the year 2000. The results suggest that the biggest declines in car commuters have come in the New York-Newark area; Washington, D.C.; Austin, Texas; and Poughkeepsie-Newburgh, N.Y. In all four urban areas, the share of workers commuting by private vehicle has dropped by 4 percent or more:
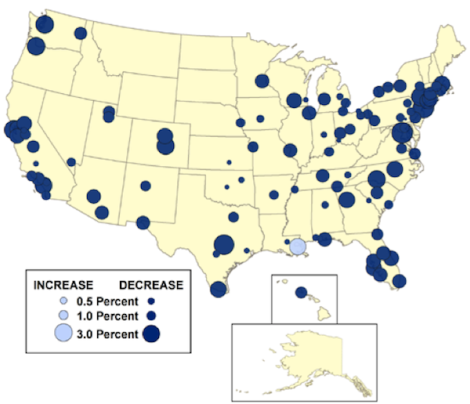
B. Davis and P. Baxandall Click to embiggen.
A small but significant shift in how Americans get around is apparent across the country by several other metrics the authors examined, using data from the Census Bureau, the Federal Highway Administration, and the Federal Transit Administration. In all cases, data wasn’t available for every urbanized area in the report (and in some cases the data spans 2005-2010, or 2006-2011), but a pattern of changing behavior emerges across the last decade:
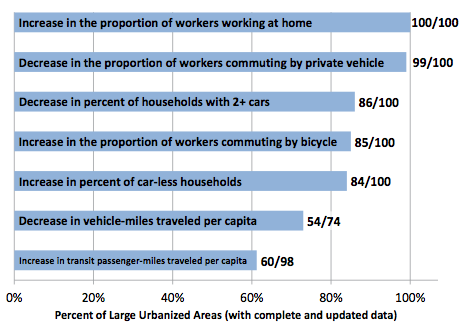
This time-span clearly encompasses the recession, an economic jolt that disrupted everything from where Americans live to how much they work (and, likely, how they got there). But Davis and Baxandall have anticipated that argument in comparing driving data against local poverty and unemployment rates:
Variations in the economy do not appear to be responsible for variations in the trends in driving among urbanized areas. In fact, the economies of urbanized areas with large declines in driving have been less affected by the recession according to unemployment and poverty indicators.
New York, Austin, and Washington all seem like obvious examples of places that weathered the recession well, and where commuters could afford to drive less with ample alternative modes of transportation. But some of the other cities highlighted in the report are more surprising.
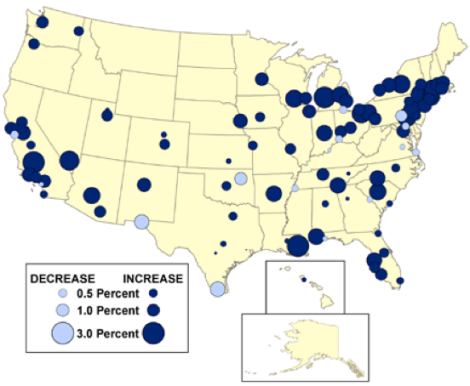
Between 2006 and 2011, for instance, the largest declines in vehicle miles traveled per capita (excluding some large states where data wasn’t available) took place in New Orleans, Milwaukee, Madison, and Harrisburg and Pittsburgh, Pa.:
Below, also between 2006-2011, are the urban areas with the largest increases in households without a car. The top five places on the list includes several hit hard by the housing bust: Poughkeepsie-Newburgh, N.Y.; New Orleans; Bakersfield, Calif.; Grand Rapids, Mich.; and Las Vegas.
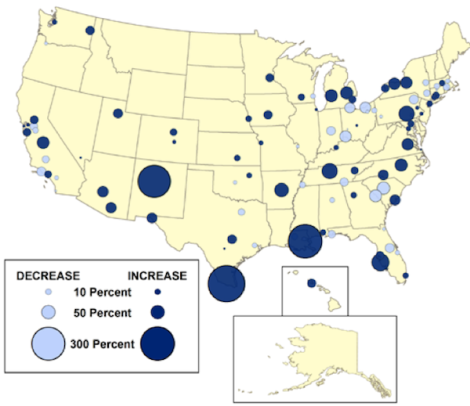
Meanwhile, here is where VMT per capita has increased the most on public transit (from 2005-2010), led by McAllen, Texas; New Orleans; Albuquerque, N.M.; Sarasota-Bradenton, Fla.; and Harrisburg again:
This type of data — as with all data on the decline in driving — will likely offer a clearer picture five or 10 years from now, once we’re further removed from the recession. It’s notable, however, that the fledgling shift appears more pervasive at the city level than a trend in just a few celebrated biking and transit hotspots.
 This story was produced by The Atlantic Cities as part of the Climate Desk collaboration.

