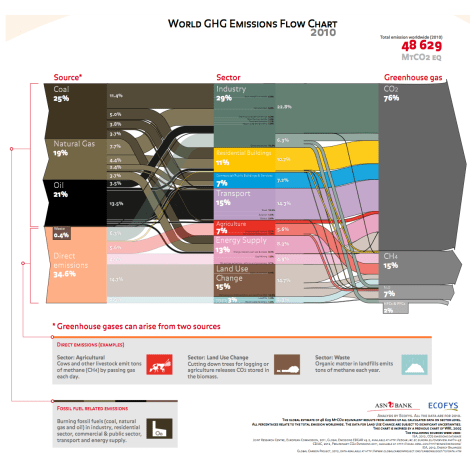
Here’s a tiny version of a large, information-dense graphic from research consultancy Ecofys:

EcofysClick to embiggen.
You should click and look at the big version, or better yet get the PDF from Ecofys and zoom in really close, where you can see the sectors further broken down.
No grand conclusions to draw, just something to think on. Every one of these sources can be dialed down, through conservation and efficiency if nothing else, but off the top of my head I’d say the easiest targets for rapid emission reductions, in no particular order, are: 1) stop chopping forests down, 2) zero out emissions from residential and commercial buildings, 3) capture methane everywhere, from agriculture to energy to solid waste, 4) reduce vehicle-miles-traveled with densification and transit, then electrify the hell out of everything else in transportation.
The tough nut to crack, it seems to me, is industrial uses of coal. Industry uses coal for high-heat operations like coking for steel production and it’s difficult to replace that kind of thing with electricity. Maybe renewables will eventually crowd natural gas out of electricity and into industry, where it can displace coal? I’d like to hear more about how to squeeze coal out of industry, if anyone knows of good studies.
Anyway, what do you think? What are the top-line lessons of this graphic?


