Don’t stand where those blurry lights are.
One of the cool things about a city the size of New York is that it generates a lot of data. A lot of people, a lot of interaction, a lot of events. At the end of every fiscal year, the city’s deputy mayor for operations puts together a document outlining how New York is doing on various metrics.
This year, there was at least one big surprise: Traffic fatalities increased. From the New York Times:
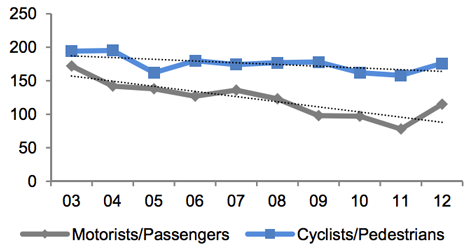
Traffic fatalities from July 2011 through June 2012 were up 23 percent from the previous year — to 291, from 236. It was the first increase since 2007, when there were 310 traffic fatalities.
Though overall crashes fell slightly for the second straight year, 176 cyclists or pedestrians were killed in crashes, up from 158 the previous year. The other 115 deaths were motorists or their passengers, a sharp rise from the 78 drivers and passengers killed the year before. …
According to the Mayor’s Management Report, speeding, driving while intoxicated, and running red lights or stop signs accounted for a combined 54 percent of motorist or passenger fatalities. The report said a preliminary analysis suggested that the crashes were concentrated on highways, far removed from many of the areas that have been the focus of the city’s initiatives.
Traffic deaths:
The increase was a surprise to the city and advocates alike. The commissioner of transportation, Janette Sadik-Khan, put blame on mobile devices.
“I don’t think that the iPhone has invented an app yet that will ping you when you hit a crosswalk,” Ms. Sadik-Khan said, adding, “That breakup text can wait.”
There is no data to suggest that distracted driving and walking have become more pervasive in the city over the past year than in previous years, though Ms. Sadik-Khan said national trends suggested that the practices had grown more common. (Overall traffic fatalities did increase nationally for the first quarter of 2012 by 13.5 percent, compared with the same period in 2011, after five consecutive years of declines, according to the National Highway Traffic Safety Administration.)
Ms. Sadik-Khan said she had even “saved three or four people” from walking into oncoming traffic herself, grabbing them as their heads remained bent down toward their phones.
(Oy. You should not break up with someone via text message, no matter what the commissioner of the Department of Transportation says.)
As I said, though, this is just one interesting data point from the report. (You can download the full thing here, if you want.) Here are some other interesting data series.
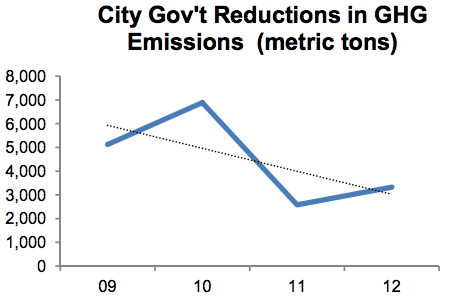
City greenhouse gas emissions
Up slightly. (They’ve only been tracking this since 2009.)
Total energy purchased by city government
Down!

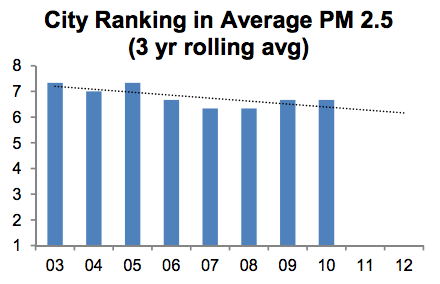
Rolling average of small particulates in the air
Kind of the same!
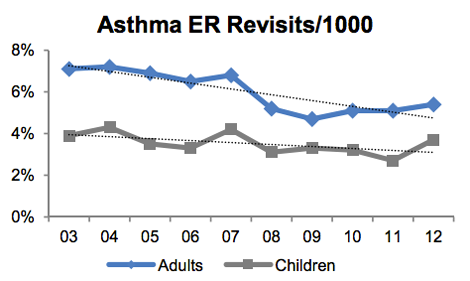
Asthma emergency room visits
Up — pretty substantially for kids.
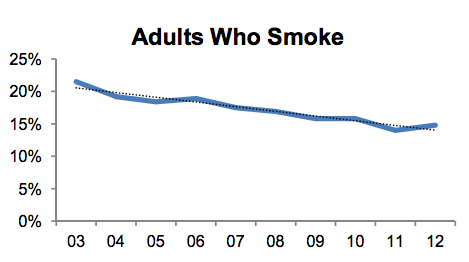
Adults who smoke
Down!
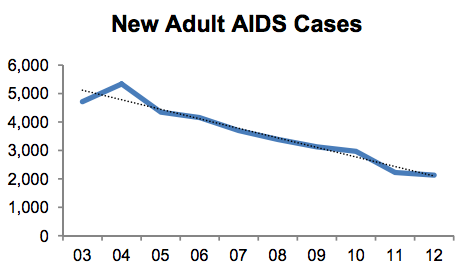
New AIDS cases
Down!
And one more…
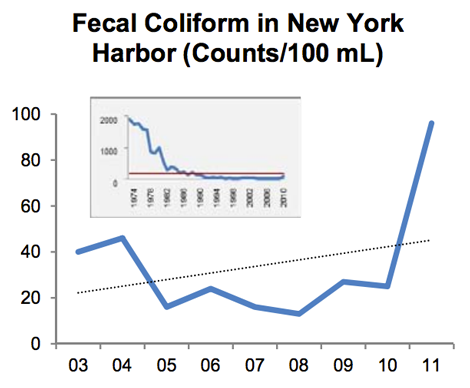
Fecal coliform in New York Harbor
Way up.
The city explains:
In 2011, fecal coliform concentrations were higher than in the previous years due to extreme amounts of rainfall in August, including Hurricane Irene. … The insert shows the trend back to 1974.
Look, guys. I don’t care how much you love Seinfeld — under no conditions should you enter a New York City waterway. Probably not even with a boat under you.
Maybe don’t walk on the sidewalks either. Actually, thinking about it — you should probably just never come to New York.

