Climate DeskClick to embiggen.
For more than a decade, the question of how global warming is affecting the scariest storms on the planet — hurricanes — has been shot through with uncertainty. The chief reason is technological: In many parts of the world, storm strengths are estimated solely based on satellite images. Technologies and techniques for doing this have improved over time, meaning that there is always a problem with claiming that today’s storms are stronger than yesterday’s. After all, they might just be better observed.
That’s why, despite expectations that global warming will make hurricanes stronger — as well as massive societal consequences if more powerful storms are slamming coastlines — scientific authorities like the United Nation’s Intergovernmental Panel on Climate Change have demurred on the hurricane/climate question. Most recently, the IPCC earlier this year said it had “low confidence” that global warming is worsening hurricanes.
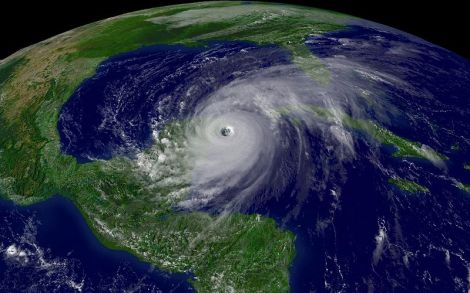
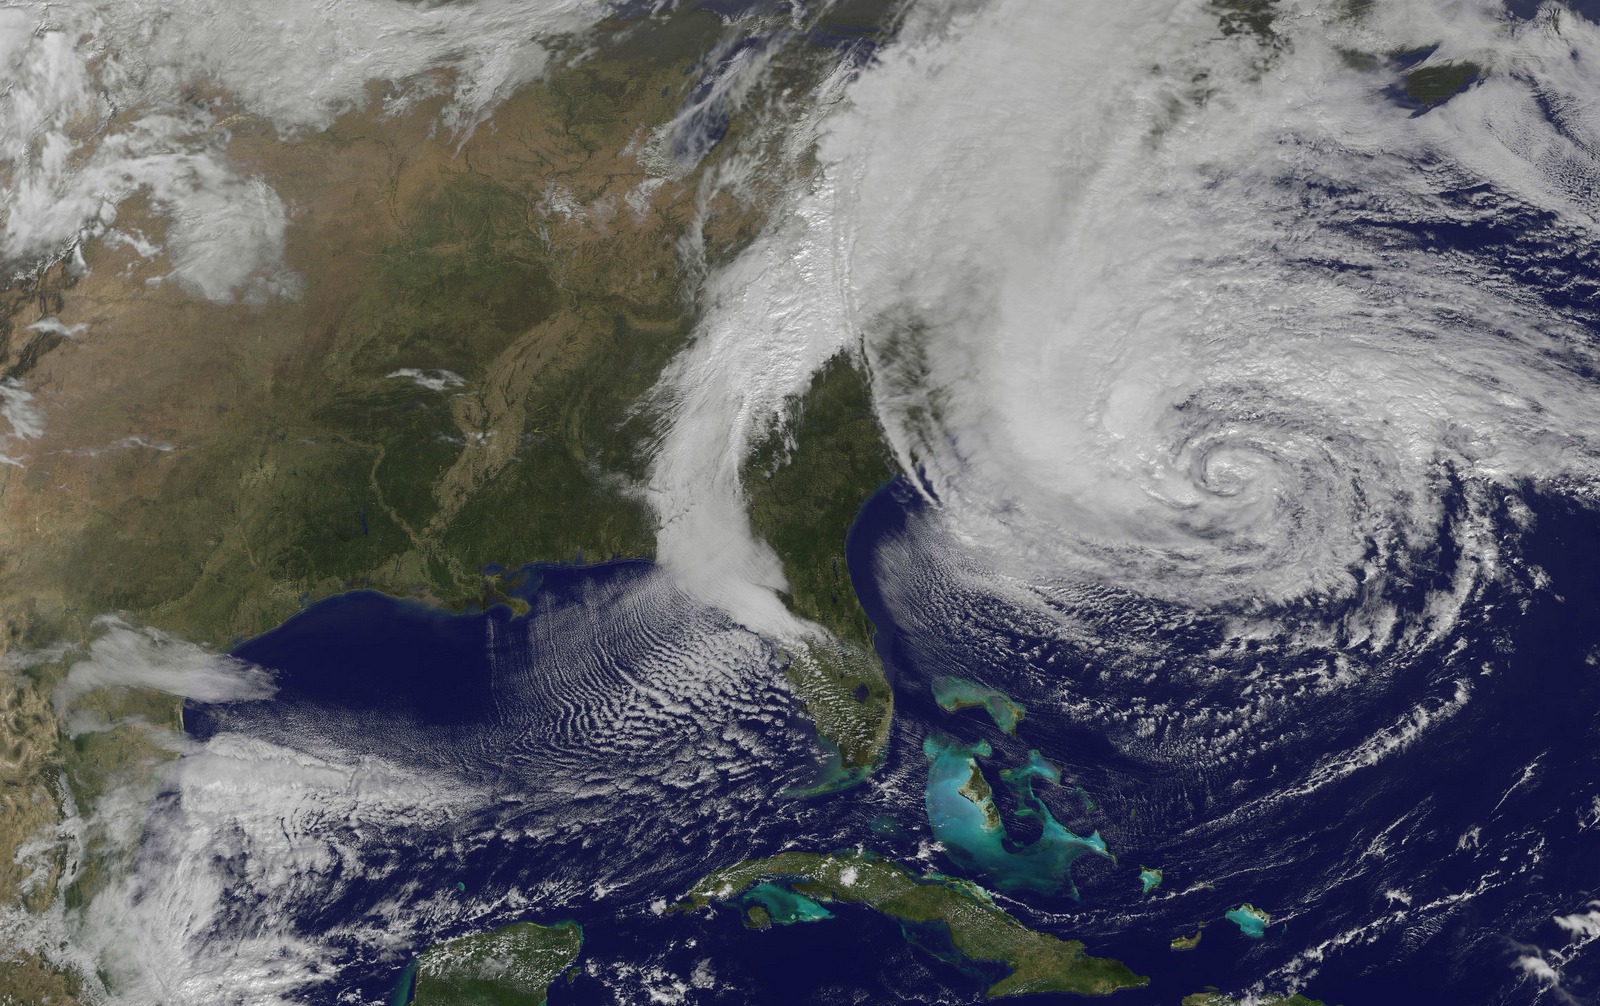
NOAA/Wikimedia CommonsHurricane Wilma of 2005, which set the Atlantic Basin record for the lowest pressure recorded in a hurricane at 882 millibars.
But maybe, just maybe, a new scientific paper has managed to get past this long-standing data problem. The study, just out in the Journal of Climate from hurricane and satellite expert Jim Kossin of the National Climatic Data Center and his colleagues, seeks to create a completely consistent database of hurricane satellite images that will finally allow for apples-to-apples comparisons. How? “We can’t take bad data and make it good, because that’s adding information that we don’t have,” explains Kossin. “But we can take the good information and make it worse.”
That’s the surprising solution that the scientists implemented in their paper. Data that was too “good” — for instance, because the satellite images were too high in resolution — was degraded to what Kossin calls the “lowest common denominator”: one satellite image of each storm taken every three hours, with a pixel size no greater than eight kilometers by eight kilometers. Using this technique, Kossin and his colleagues at NCDC created a 28-year record of storm images across the world’s seven hurricane basins, from 1982 to 2009. Then they used a computer algorithm to compute each storm’s maximum strength, removing human error and unpredictability from the equation.
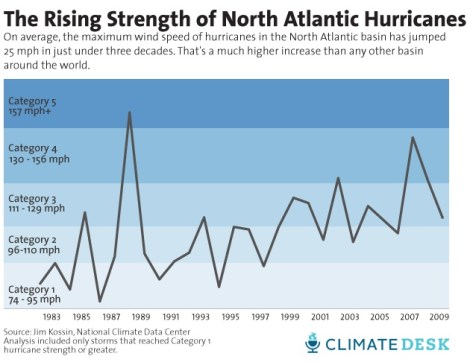
The result? The scientists found that globally, hurricane wind speeds are increasing at a rate of a little more than two miles per hour per decade, or just faster than six miles per hour over the entire period. There are some key caveats, though, the biggest being that the trend they found was not statistically significant at usually accepted levels. (For nerds: the p value was 0.1). But there were strong and significant trends in some hurricane basins of the world, especially the North Atlantic (the region encompassing the Caribbean, Gulf of Mexico, and open Atlantic north of the equator), where storms have been strengthening at the rate of nearly nine miles per hour per decade (see chart above). But other basins offset that, including the western North Pacific, which showed a negative trend.
The punch line, then, could hardly be called overwhelming. But as Kossin explains, that may be precisely what you expect to see once you’re finally analyzing the troublesome hurricane data reliably. These results, after all, are quite consistent with the idea that the signal of hurricane intensification might be just now emerging from the “noise” of natural climate variability. “What we’re observing could very easily fit into an assumption of this greenhouse gas forced trend in the tropics and the effect that it has on tropical cyclone intensity,” says Kossin.
Perhaps the best news is that if scientists continue adding to the new database of homogenized satellite images — starting with the years 2010-13, which were not part of this study — the chance of finding a significant trend (or showing that there just isn’t one to be found) will increase. “I think every year, we’ll get a little bit closer to the truth,” says Kossin.
At that point, perhaps we can finally can leave the sound and fury to the hurricanes themselves, rather than the debate over what’s happening to them.
 This story was produced as part of the Climate Desk collaboration.