The United States is undergoing the greatest revolution in energy production in decades thanks to the shale gas boom and the rise of renewable energy.
The lure of cheap natural gas has led utilities to shutter aging and carbon-spewing coal-fired power plants in favor of much cleaner burning gas. Pending federal emissions regulations make it unlikely that any new coal plants will get built in the years ahead, while state renewable energy mandates and the declining cost of solar and wind technologies have triggered a boom in green power.
That trend is likely to continue in the decades ahead.
The U.S. Energy Information Administration, the nation’s power statistician, tends to take a conservative tact when it comes to the future. Under its basic projection, they predict, essentially, stasis in an industry that has seen massive changes over the last hundred years:
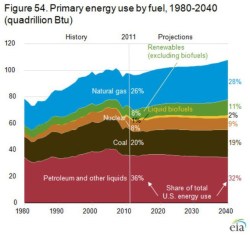
U.S. Energy Information Administration
But under their more aggressive projections, King Coal’s days are numbered as the U.S.’ main energy source:
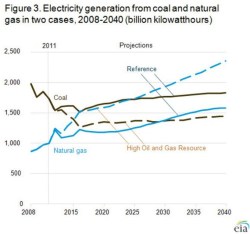
U.S. Energy Information Administration
Why? Shale gas, naturally. The environmental controversies surrounding hydraulic fracturing, or fracking, aside, shale gas’ share of the nation’s energy production continues to rise, making the U.S. by far the world’s leading producer:
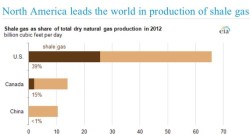
U.S. Energy Information Administration
Renewable energy’s share of production remains small but is rising rapidly. Solar, in particular, has benefited from a sharp drop in the price of photovoltaic modules as a result of a massive expansion of manufacturing capacity in recent years:
Power plants are multibillion-dollar investments and are designed to operate for decades. Thus, all those natural gas-fired power plants and solar and wind farms coming online now will be fueling the economy for a good chunk of the 21st century.
The chart below shows when the capacity that we use to power the grid came online. A lot of the dirty coal plants are more than 30 years old.
This story first appeared on the Atlantic website as part of the Climate Desk collaboration.