The installed cost of solar photovoltaic (PV) power continues its precipitous decline, mostly due to falling prices for PV panels. Pushing solar forward in coming years will involve driving down the other costs — the non-panel costs.
Those are a couple of the insights to be found in the fifth annual report on solar PV [PDF] from Lawrence Berkeley National Laboratory (LBNL), which digs into “project-level data for more than 150,000 individual residential, commercial, and utility-scale PV systems, totaling more than 3,000 megawatts (MW) and representing 76% of all grid-connected PV capacity installed in the United States through 2011.” That’s an incredibly rich source of data (though it does have some limitations — for one thing, it doesn’t reflect the even more precipitous decline in prices thus far in 2012).
So what do we learn from LBNL?
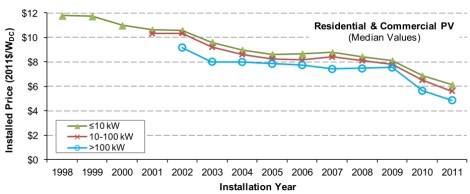
Installed costs are falling for solar PV systems of every size:
Most of the sharp decline that begins in 2009 is attributable to declining solar-panel prices (though Obama’s stimulus bill didn’t hurt). The nerds call these “module prices” and everything else — customer acquisition, financing, permitting, installation, maintenance, worker training, etc. — “non-module prices.” The latter are also known as “balance of system costs” or sometimes [this isn’t right — balance of system costs have to do with non-module hardware specifically] “soft costs.”
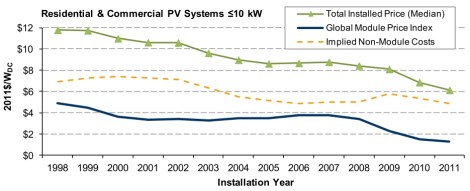
Here’s an illustrative graph showing how how module and non-module costs compare in small PV installations:
As you can see, panel prices have fallen sharply since about 2008, but, at least since 2005, soft costs have been largely stagnant.
These are averages, though. What they don’t show is that costs vary widely from project to project. For instance, they vary widely from state to state.
Across all three system size ranges, substantial differences in median installed prices can be observed. Specifically, among systems ≤10 kW in size, median installed prices range from a low of $4.9/W in Texas to a high of $7.6/W in Washington, D.C. Within the 10-100 kW size range, median installed prices range from $5.0/W in Florida and Nevada to $7.2/W in Texas. Finally, for systems >100 kW, median installed prices range from $4.5/W in Pennsylvania to $6.2/W in Arizona.
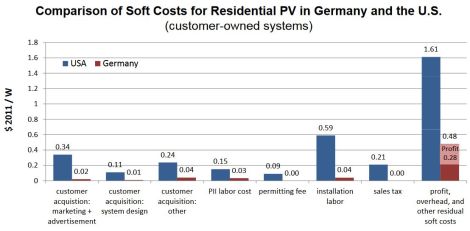
Since solar panels are well on their way to being commoditized — that is, more or less fungible and similarly priced across markets — most of that variation can be explained by differences in soft costs.
An earlier LBNL report showed that over half the difference between the low cost of German rooftop PV (around $3.4/kW) and the comparatively high cost of the American variety (around $6/kW) is in soft costs:
I imagine the story is the same among U.S. states.
What this illustrates is a point I’ve become fond of making: When it comes to accelerating the wide deployment and falling costs of clean energy, market innovation is every bit as important as technological innovation. Even if PV technology remains static (which of course won’t happen), enormous savings could be had simply through market building — helping markets with high soft costs match the performance of those with low soft costs.
Part of that will be professionalization and scale in the industry itself. And part of it will be a matter for public policy — not only government incentives but, just as importantly, removal of legislative and regulatory barriers at the local and state level. This is precisely the kind of thing that the Department of Energy’s SunShot program is working on.
“Driving down soft costs” is a pretty boring bumper sticker. But what’s it’s really about is the Apple-ification of solar: making solar consumer-friendly, standardized, simple, and appealing. It can be done. We just have to decide to do it.

