
The Institute for Quality Communities at the University of Oklahoma recently dug through the latest Census metrics on how Americans commute to work, a dataset locally notable for the fact that Tulsa and Oklahoma City don’t compare all that well. Relative to the 60 largest cities in America, Oklahoma City ranks last in the share of commuters — 2.2 percent of them — who get to work by biking, walking, or public transit. That’s as much a reflection of the design of the city as the preferences of its commuters: Simply put, Oklahoma City was built for cars.
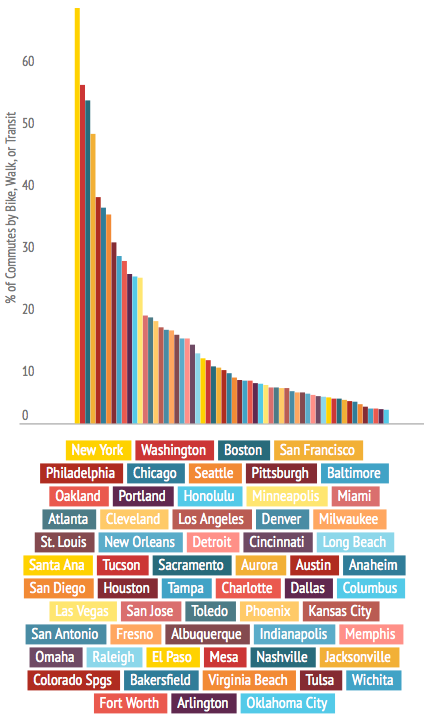
In the process of unearthing this ignoble distinction, IQC fellow Shane Hampton also posted some nice visualizations of how major cities stack up against each other by commuter mode share. The data comes from the 2012 American Community Survey, which records how people primarily get to and from their jobs (not necessarily how they make all of their daily trips, to destinations like the grocery store or church). The original charts are interactive, with individual data points. But we’ve pulled out a few here as well.
New York, not surprisingly, has the highest share of non-car commuters (67 percent):
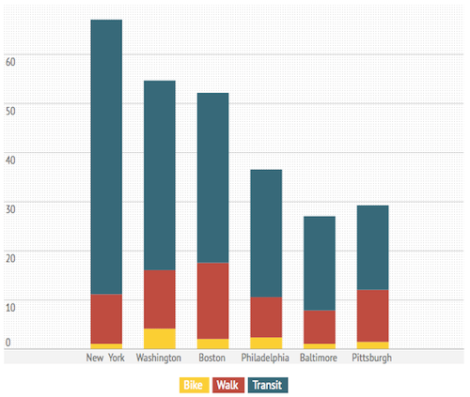
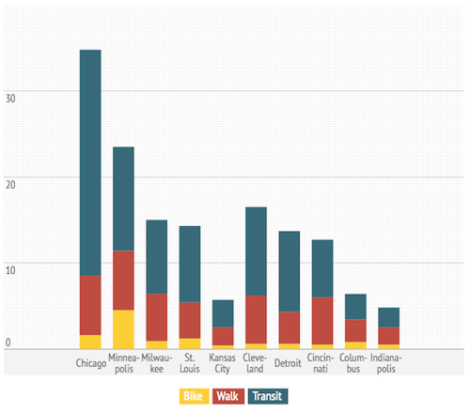
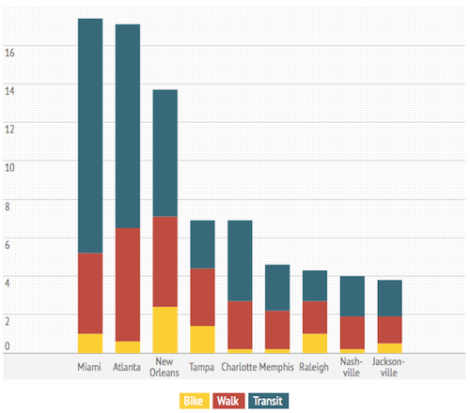
Breaking that down by region and individual mode share, here is the Northeast, the Midwest, and the Southeast. Beware, each scale is different:
Northeast
Midwest
Southeast
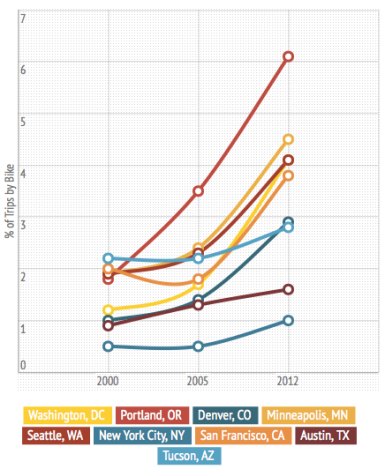
And here is a range of cities — from notably different climates, Hampton points out — where biking mode share has significantly increased in the last decade:
All charts courtesy of the University of Oklahoma Institute for Quality Communities.
 This story was produced by Atlantic Cities as part of the Climate Desk collaboration.
A message from
Your support keeps our climate news free.
Grist is the only award-winning newsroom focused on exploring equitable solutions to climate change. It’s vital reporting made entirely possible by loyal readers like you.
At Grist, we don’t believe in paywalls. Instead, we rely on our readers to pitch in what they can so that we can continue bringing you our solution-based climate news. Donate today to keep our site free.