Global leaders are meeting in New York this week to sign the Paris climate agreement. One of the expressed purposes of the document is to limit warming to “well below 2 degrees C above pre-industrial levels and pursuing efforts to limit the temperature increase to 1.5 degrees C.”
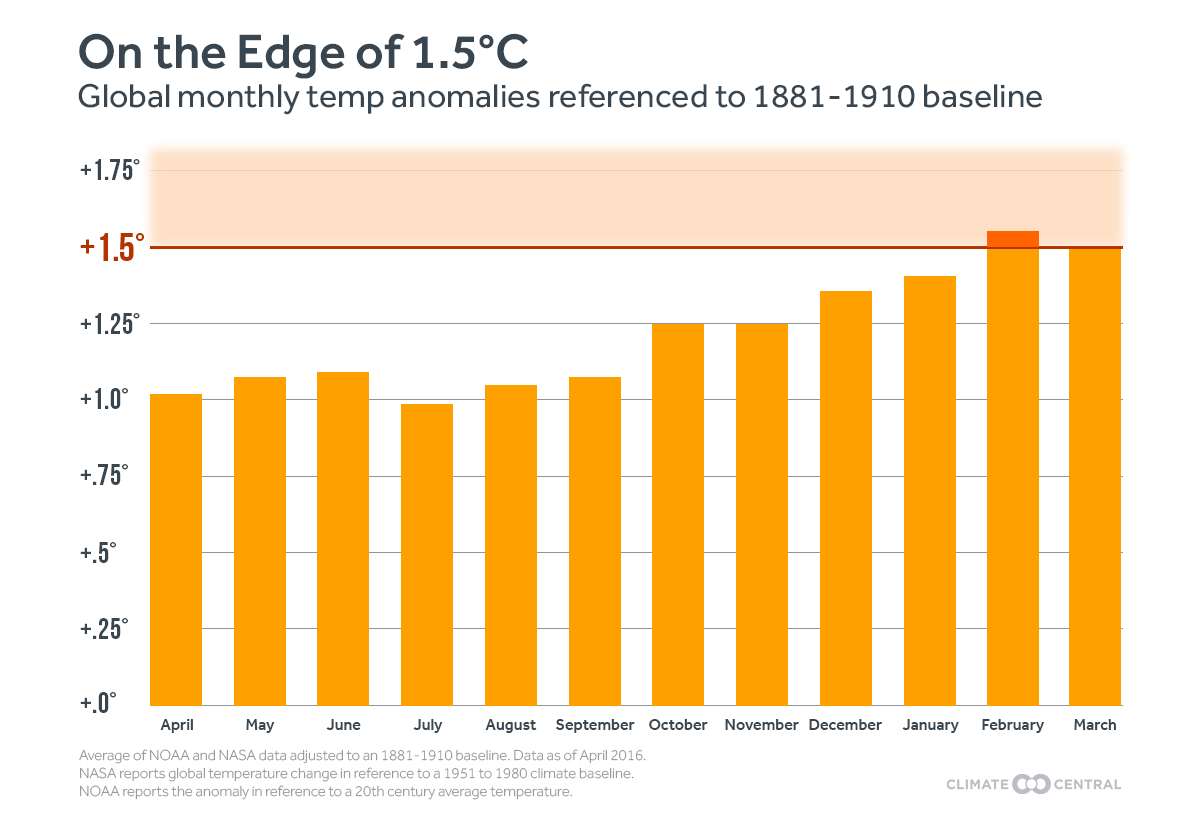
A Climate Central analysis shows that the world will have to dramatically accelerate emissions reductions if it wants to meet that goal. The average global temperature change for the first three months of 2016 was 1.48 degrees C, essentially equaling the 1.5 degrees C warming threshold agreed to by COP 21 negotiators in Paris last December.
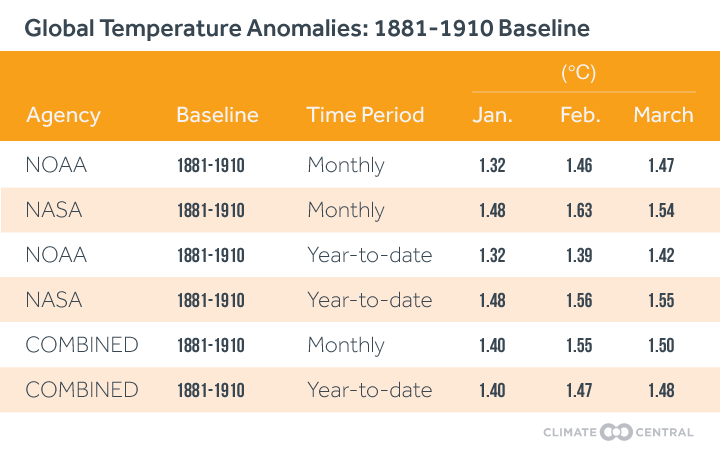
February exceeded the 1.5 degrees C target at 1.55 degrees C, marking the first time the global average temperature has surpassed the sobering milestone in any month. March followed suit checking in at 1.5 degrees C. January’s mark of 1.4 degrees C, put the global average temperature change from early industrial levels for the first three months of 2016 at 1.48 degrees C.

Climate Central
Climate Central scientists and statisticians made these calculations based on an average of global temperature data reported by NASA and the National Oceanic and Atmospheric Administration (NOAA). But rather than using the baselines those agencies employ, Climate Central compared 2016’s temperature anomalies to an 1881-1910 average temperature baseline, the earliest date for which global temperature data are considered reliable. NASA reports global temperature change in reference to a 1951-1980 climate baseline, and NOAA reports the anomaly in reference to a 20th century average temperature.
NASA’s data alone showed a February temperature anomaly of 1.63 degrees C above early industrial levels with March at 1.54 degrees C.
Calculating a baseline closer to the pre-industrial era provides a useful measure of global temperature for policymakers and the public to better track how successful the world’s efforts are in keeping global warming below agreed-upon thresholds.
A similar adjustment can be applied to some of the temperature change projections in the most recent IPCC report.
The IPCC AR5 Working Group 1 Report contains projections of future global surface temperature change according to several scenarios of future socio-economic development, most of which are presented using a baseline of 1986 to 2005. The IPCC chose this baseline in order to provide its readers a more immediate base of comparison, the climate of the present world, which people are familiar with. But these representations may suggest that the Paris goals are easier to reach than is true.
The IPCC’s presentation of these scenarios was not designed to inform the discussion about warming limits (e.g., 1.5 degrees C, 2 degrees C goals of the Paris COP21 agreements). But the Panel does provide a way to make its projections of future warming consistent with discussions about targets.
IPCC estimates, using the best and longest record available, show that the difference between the 1986-2005 global average temperature value used in most of the Panel’s projections, and pre-industrial global average temperature, is 0.61 degrees C (0.55-0.67). Neglecting 0.61 degrees C warming is not trivial, and makes a significant difference for the assessment of the goals established in Paris. In fact, 0.61 degrees C amounts to about half the warming already experienced thus far.
To capture this warming and display the IPCC warming time series relative to the pre-industrial period, Climate Central adjusted a well known IPCC projection (SPM7(a)) to reflect a 1880-1910 baseline. This adjustment has a significant effect on the dates at which the 1.5 and 2 degrees C thresholds are crossed, moving them up by about 15-20 years.
If current emissions trends continue (RCP8.5) we could cross the 1.5 degrees C threshold in 10 to 15 years, somewhere between the years 2025-2030, compared to 2045-2050 when a 1985-2005 baseline is used.
[protected-iframe id=”c61516d8f892683bda8b075ff6b8e6f2-5104299-15574887″ info=”https://www.climatecentral.org/wgts/new-baseline/index.html?utm_source=Grist&utm_medium=embed&utm_campaign=new-baseline” width=”660″ height=”523″ frameborder=”0″ scrolling=”no”]
The dramatic global hot streak that kicked off 2016 doesn’t mean the world has already failed to meet the goals in the Paris agreement. Three months do not make a year, and it is unlikely that 2016 will exceed the 1881-1910 climate-normal by 1.5 degrees C. This year is also in the wake of a strong El Niño, when higher-than-average temperatures would be expected.
And of course, exceeding the 1.5 degrees C threshold for even an entire year would not mean that global temperatures had in fact risen to that point, never (at least within our lifetime) to drop back below it as it’s too short of a time frame to make that determination.
But the hot start for 2016 is a notable symbolic milestone. The day the world first crossed the 400 parts per million (ppm) threshold for atmospheric carbon dioxide heralded a future of ever increasing carbon dioxide. So too, do the first three months of 2016 send a clear signal of where our world is headed and how fast we are headed there if drastic actions to reduce carbon emissions are not taken immediately.
Background
On Dec. 12, 2015, the 21st Conference of the Parties to the U.N. Framework Convention on Climate Change approved the Paris Agreement committing 195 nations of the world to “holding the increase in the global average temperature to well below 2 degrees C above preindustrial levels and pursuing efforts to limit the temperature increase to 1.5 degrees C.” The pact commits the world to adopt nationally determined policies to limit greenhouse gas emissions in accord with those goals.
The 2 degrees C goal represents a temperature increase from a pre-industrial baseline that scientists believe will maintain the relatively stable climate conditions that humans and other species have adapted to over the previous 12,000 years. It will also minimize some of the worst impacts of climate change: drought, heat waves, heavy rain and flooding, and sea-level rise. Limiting the global surface temperature increase to 1.5 degrees C would lessen these impacts even further.
1.5 and 2 degrees C are not hard and fast limits beyond which disaster is imminent, but they are now the milestones by which the world measures all progress toward slowing global warming. And yet it is surprisingly difficult to find objective measures that answer the question, where are we today on the path toward meeting the 1.5 or 2 degrees C goals?
Every month NOAA and NASA update their global surface temperature change analysis, using data from the Global Historical Climate Network, and methods validated in the peer-reviewed literature (Hansen et al. 2010; NCDC). The monthly updates are posted on their websites, and made available to the public along with the underlying data and assumptions that go into their calculations.
These calculations are enormously useful for understanding the magnitude and pace of global warming. In fact, they are the bedrock measurements validating the fact that our planet is warming at all.
But none present their results in comparison to a pre-industrial climate normal.
Methods and Results
The NASA and NOAA monthly updates are presented as anomalies, or as the deviation from a baseline climate normal, calculated as an average of a 30-year reference period, or the 20th century average; they do not represent an absolute temperature increase from a specific date. NASA presents their results in reference to a 1951 to 1980 average temperature, NOAA in reference to a 20th century average temperature.
The NASA results, calculated by Goddard Institute for Space Studies, are published monthly on the NASA/GISS website (GISTEMP). NOAA methods and monthly updates are published via the National Centers for Environmental Information here.
Climate Central used data from NASA and NOAA to create an 1881 to 1910 climate normal for the months of January, February, and March. We then compared the reported monthly 2016 anomaly for each of these months to this “early-industrial” baseline reference period. These anomalies were then averaged to produce a mean monthly NASA/NOAA anomaly for each month. The results are presented below.
The NASA anomaly is considerably higher than the anomaly reported by NOAA. This reflects the fact the NASA’s calculations are tuned to account for temperature changes at the poles, where there are far fewer monitoring stations. NOAA relies only on historical station data and makes no adjustment to account for sparse records at the poles, where warming has been more rapid relative to non-polar regions.

Climate Central


