Each year, the National Oceanic and Atmospheric Administration releases a “report card” for how the Arctic is doing. This year, the Arctic gets an incomplete and a notice to be signed by its parents stating that it will require tutoring.
Warning: sad polar bears.
The report focuses on two primary findings. First, that the year’s record ice loss comes despite a relatively unremarkable year, temperature-wise.
A major finding of the Report Card 2012 is that numerous record-setting melting events occurred, even though, with the exception of a few limited episodes, Arctic-wide it was an unremarkable year, relative to the previous decade, for a primary driver of melting — surface air temperatures. From October 2011 through August 2012, positive (warm) temperature anomalies were relatively small over the central Arctic compared to conditions in recent years (2003-2010). Yet, in spite of these moderate conditions, new records were set for sea ice extent, terrestrial snow extent, melting at the surface of the Greenland ice sheet, and permafrost temperature.
A reminder: Here’s how this year’s ice melt compared to the past.
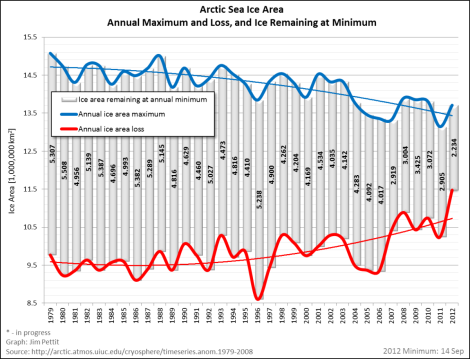
Pettit Climate GraphsClick to embiggen.
The unusually severe melt despite non-unusual temperatures is in part due to the feedback loop of melt itself.
A major source of this momentum is the fact that changes in the sea ice cover, snow cover, glaciers and Greenland ice sheet all conspire to reduce the overall surface reflectivity of the region in the summer, when the sun is ever-present. In other words, bright, white surfaces that reflect summer sunlight are being replaced by darker surfaces, e.g., ocean and land, which absorb sunlight. These conditions increase the capacity to store heat within the Arctic system, which enables more melting — a positive feedback.
The other main finding is that the melt of ice in the Arctic region is affecting the food chain.
A second key point in Report Card 2012 is that changes in the Arctic marine environment are affecting the foundation of the food web in both the terrestrial and marine ecosystems. …
For instance, new satellite remote sensing observations show the near ubiquity of ice-edge blooms throughout the Arctic and the importance of seasonal sea ice variability in regulating primary production. These results suggest that previous estimates of annual primary production in waters where these under-ice blooms develop may be about ten times too low. At a higher trophic level, seabird phenology, diet, physiology, foraging behavior and survival rates have changed in response to higher water temperatures, which affect prey species.
Changes in the terrestrial ecosystem are exemplified by vegetation and mammals. The tundra continues to become more green and in some locations above-ground plant biomass has increased by as much as 26% since 1982.
That change in surface vegetation has caused the lemming population to drop, which, in turn, has done the same to the Arctic fox, a species near extinction. At the same time, red foxes are migrating north, providing additional competition for shrinking food supplies.
So: That’s grim.
The report is loaded with graphs featuring lines that typically start at the upper left corner and then plummet down and to the right. It also contains interesting graphics like this one, showing the effect that an August storm had on ice breakup and melt near Alaska.
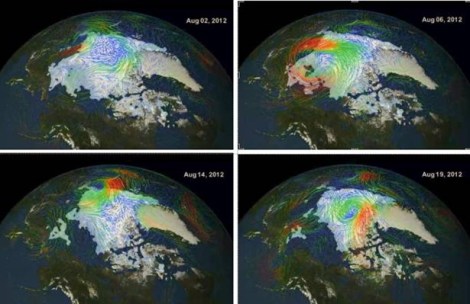
NASAClick to embiggen.
It’s probably not really accurate to call this document a report card. It’s far more of a crystal ball, sort of an SAT gauging how the future might look. And it doesn’t look very good.
