The pandemic is far from over, but some states are opening back up again, creating a situation where life is going back to some semblance of normal in some areas of the United States and staying eerily quiet in other places. A new analysis in the science journal Nature Climate Change sheds light on what happened to emissions during the months when the U.S. was maximally locked down.
Previous estimates of emissions reductions due to COVID-19 said the pandemic would take an 8 percent bite out of global emissions this year. This study, published Tuesday, is the first to analyze and quantify emissions drops on a day-to-day basis across 69 countries and state by state in the United States.
It found that the world is on track for the biggest emissions drop since World War II, or maybe even the biggest drop in history, depending on how long global lockdowns stay in place. (The study estimates that by the end of the year emissions could decline anywhere between 2 to 13 percent overall, depending on the nature and duration of governments’ lockdown policies.) During the peak of global lockdowns in early April, average daily emissions decreased by 17 percent compared to the 2019 average, hitting their lowest point since 2006. Nearly half of those emissions were from “surface transport,” like car rides.
In the U.S., emissions dropped by about a third for a couple of weeks in April, a development that Robert Jackson, a co-author of the study and a Guggenheim fellow at Stanford University, told Grist was “absolutely unprecedented.” On a national level, emissions decreased by about a quarter on average during each country’s peak of confinement.
Jackson and his fellow researchers created a “confinement index” to describe how locked down 69 countries were between the months of January and April according to three levels of confinement ranging from broad travel restrictions to “policies that substantially restrict the daily routine of all but key workers.” By examining six economic sectors — aviation, electricity, transportation, public buildings and commerce, residential, and industry — the study’s authors were able to determine to what extent economic activity, and the carbon dioxide emissions that accompany it, slowed as a result of which lockdown measures. The 69 countries they analyzed represent 97 percent of global CO2 emissions.
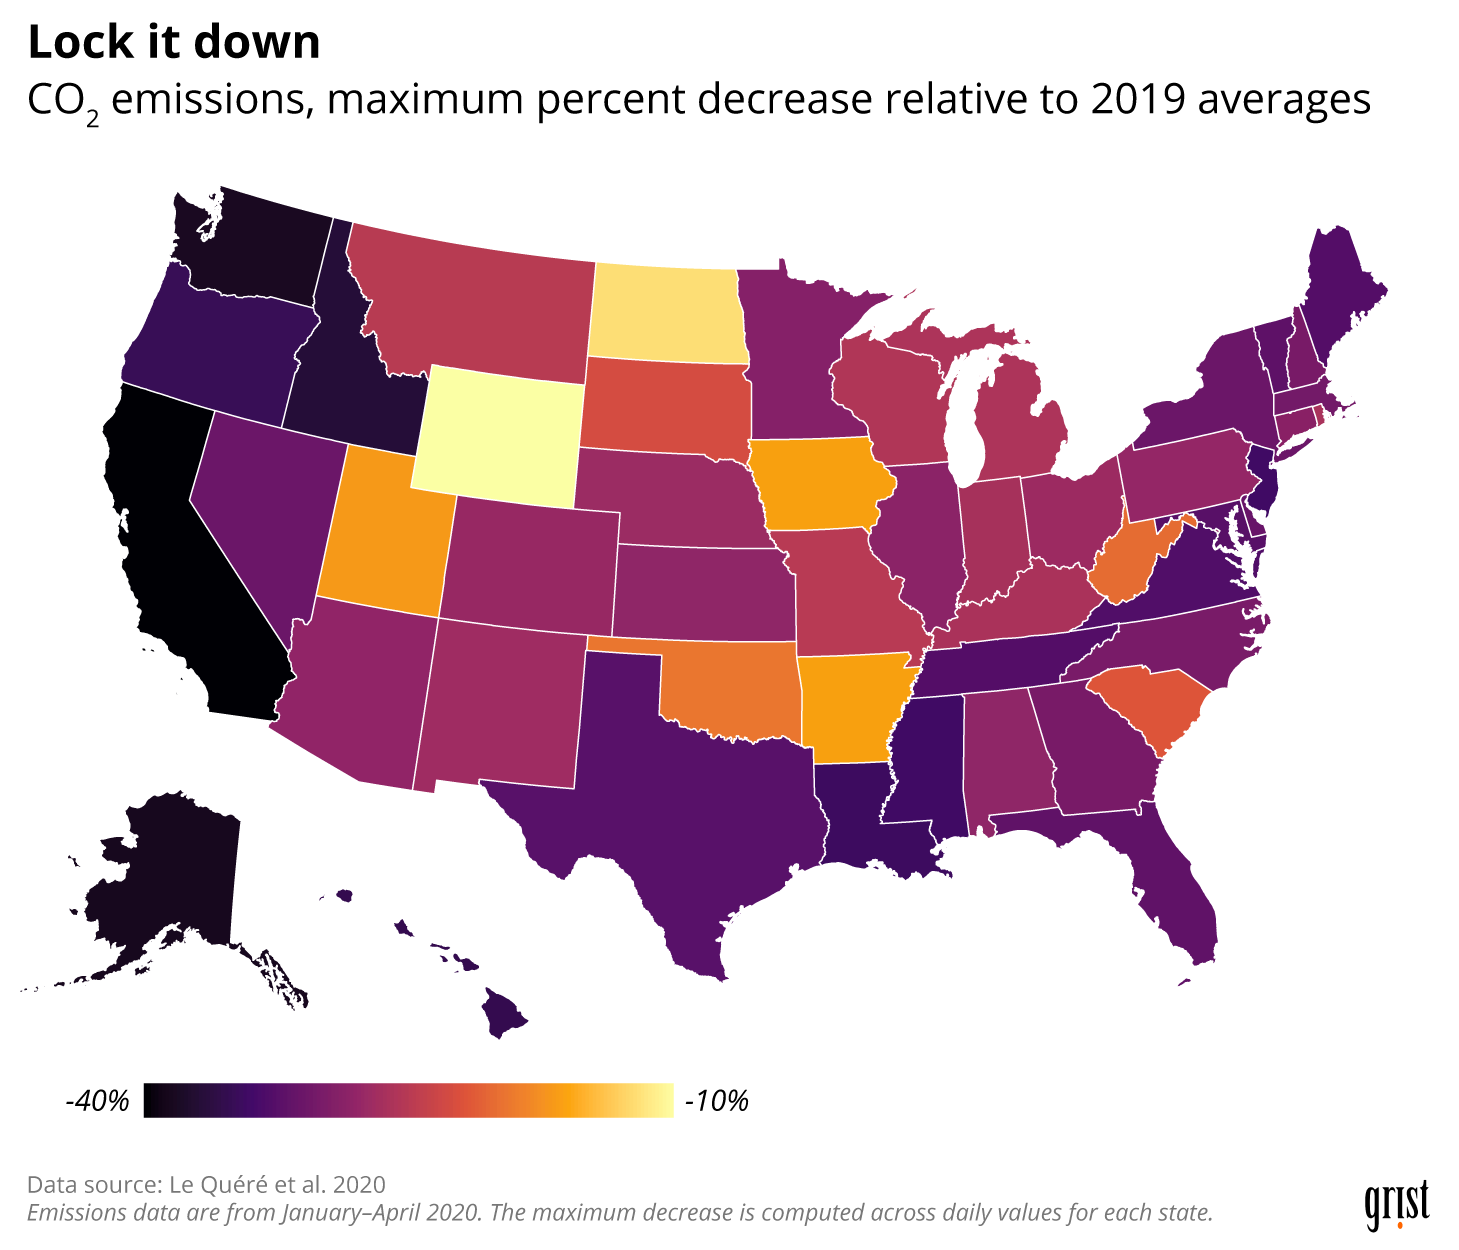
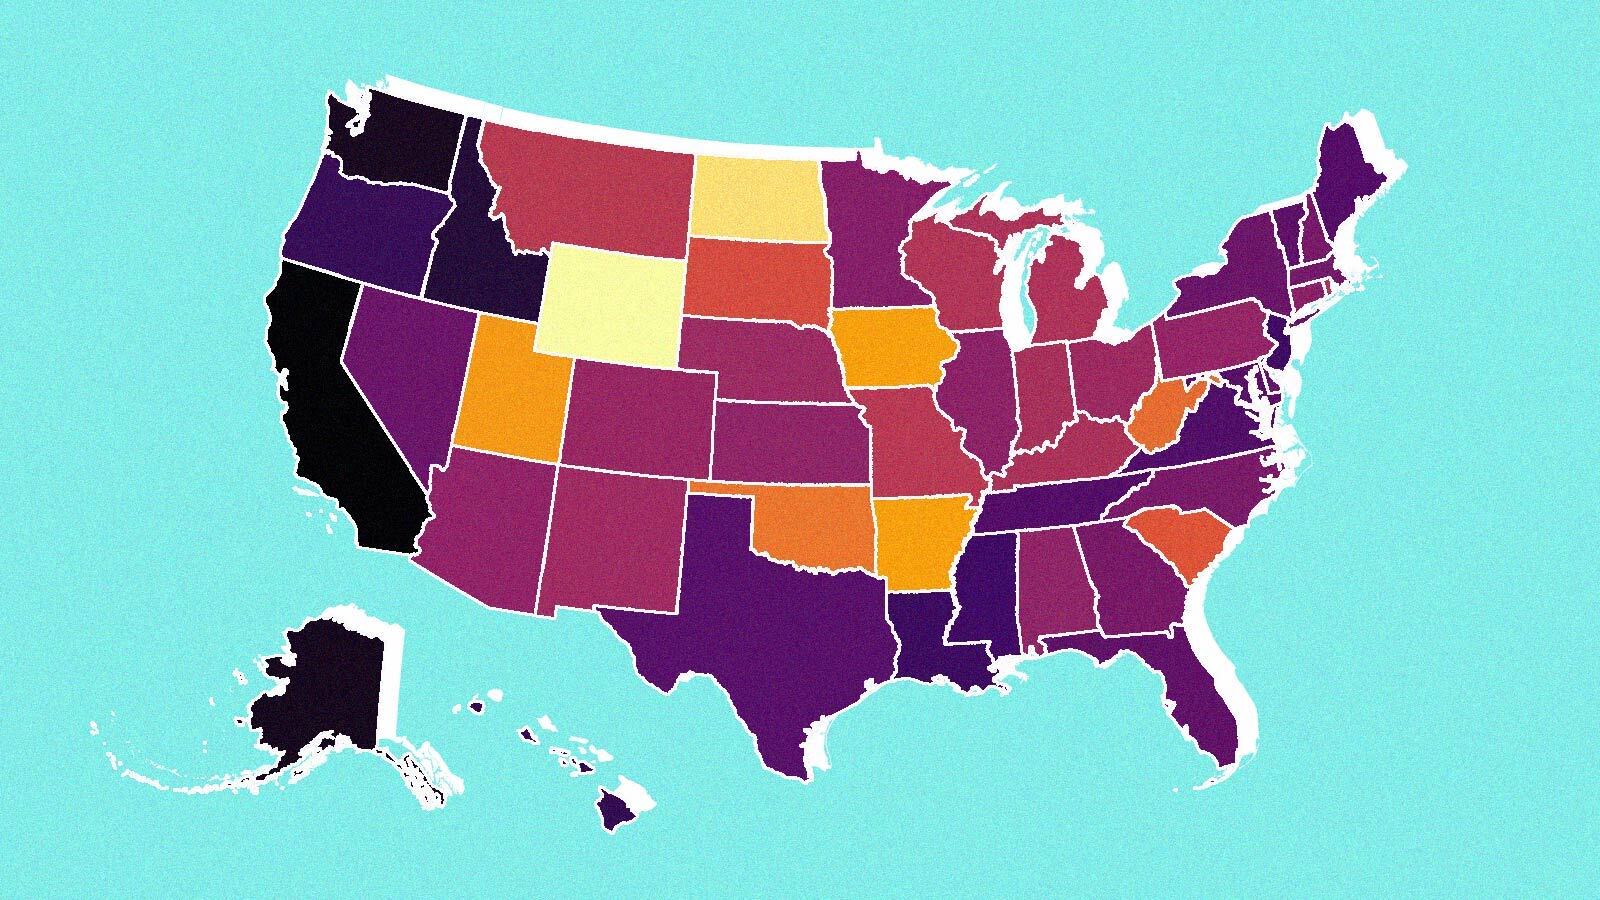
In the U.S., the study showed some major differences between states’ daily maximum emissions reductions. Washington state, for example, saw a more than 40 percent drop in emissions during its peak confinement, whereas the pandemic swallowed up just under 18 percent of Iowa’s emissions during its peak. Jackson says there’s a fairly straightforward reason why some states saw such big emissions deficits. “In general, states that are more rural acted much more slowly than states with big cities,” he said. In a few months’ time, those differences between states could deepen even more as the easing of lockdown restrictions in some states spur an increase in emissions.

Clayton Aldern / Grist
For the most part, the emissions decline will only last as long as the lockdowns. “Previous crises have not dented emissions very much,” he said, referencing the 2008 financial crash that decreased emissions globally by 1.5 percent for a year. By 2010, emissions had come roaring back, increasing 5 percent globally. “We’re forcing people to stay at home,” Jackson said. “That won’t last. If they hop back in their cars and consume at the same levels things will go back to normal.”
But Jackson says the pandemic has provided an opportunity for people to rethink transportation, at the very least. Sitting in an hour of traffic to get to work doesn’t sound super appealing after months of commuting 30 seconds to the dining room table. “That could jolt us into a longer-term drop in emissions,” he said.


