One of President Joe Biden’s first executive orders promised that “disadvantaged communities” would receive at least 40 percent of the overall benefits of government spending on infrastructure, clean energy, and other climate-related programs. It’s a historic commitment to reducing pollution and bringing new investment to the areas most in need.
But who the “Justice40” program ends up serving rests, in large part, on a deceptively simple question: What defines a disadvantaged community?
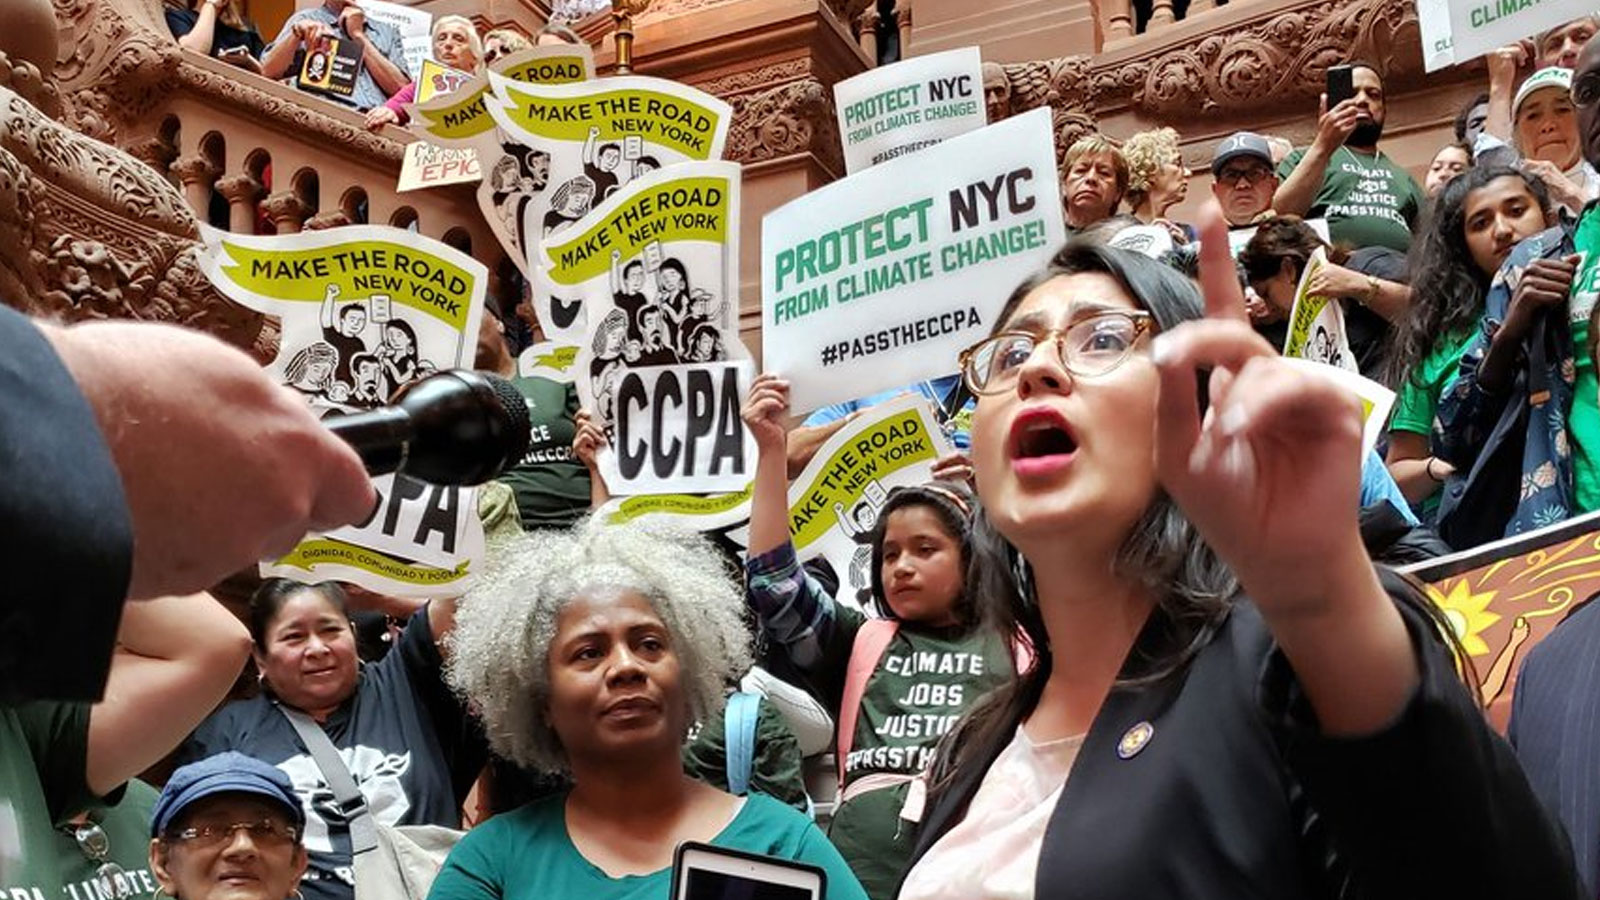
While little has been released publicly about how this question is being adjudicated at the federal level, environmental justice leaders are currently grappling with it at the state level in New York, where the idea for Justice40 originated. In 2019, a coalition of Empire State environmental groups successfully lobbied for a similar provision to be included in a statewide climate change bill, now known as the Climate Leadership and Community Protection Act. Now, several members of that coalition are participating in a working group that’s developing the state’s official definition for “disadvantaged communities,” or DACs, under the supervision of the state’s Department of Environmental Conservation, or DEC.
This isn’t a matter of crafting a statement that you might find in a dictionary. The unpaid advisory group, which includes the leaders of community organizations from across the state, has a much more complicated task. It involves not only deciding on a set of criteria for the definition, but also choosing the data points that will measure that criteria, and then working out how to combine those data points to score and rank every community in the state. These technical decisions will determine which of New York’s census tracts will be prioritized for pollution cleanup, clean energy programs, job training, public transportation improvements, and energy efficiency upgrades that lower utility bills — and which will not.
The working group plans to finish its draft definition by September. It will then undergo a 120-day comment period during which at least six public hearings will be held before the definition is finalized.
Many working group members are longtime environmental justice advocates who have played advisory roles in past government efforts to engage with communities. Several told Grist that they hope their participation in this foundational work is a break with those previous experiences.
“For years what agencies have done is manage our expectations,” said Elizabeth Yeampierre, executive director of the Brooklyn-based nonprofit Uprose. “They have this dog and pony show where they basically cook the solutions, and then bring them to communities to see if we can provide them with input and respond to something that they created without us.”
Yeampierre said this working group is an opportunity to demand a different kind of practice. “We’re saying that climate change really demands co-governance — that communities need to be seen as the experts and as a resource,” she explained.
But in a state as geographically and socioeconomically diverse as New York, weighing the hardships that communities face and channeling them into a single equation is a tall order. Every decision has the potential to make the policy more or less effective at reaching communities that are the most marginalized, vulnerable, and in need of targeted assistance. The working group has had to wrestle with the limitations of key data sets, a bias toward urban areas in existing metrics, and the reality that even the best definition cannot alone overcome local resource and capacity constraints that might prevent the most disadvantaged communities from accessing funding.
During a working group meeting in June, Amanda Dwelley, director of quantitative research at the consulting firm Illume, compared the group’s project to baking a cake.
First, they need ingredients: in this case, geographic data sets that measure different types of disadvantages that communities experience. These might be measures of certain air and water pollutants like benzene, concentrations of health problems like asthma, socioeconomic vulnerabilities like poverty and race, or climate change-related risks like future flood projections. One of the first things the working group did when they began meeting late last summer was brainstorm as many of these “ingredients” as they could. The initial list included more than 150.
Dwelley, who was hired by the state to help guide the working group through this highly technical and data-centric process, said Illume then worked with the DEC to pare that initial list down to about 40 different metrics. Some of the items were eliminated because they were redundant, but many had to be dropped because there was simply no reliable statewide or census tract-level data — or no data at all — to measure them.
For example, though the group wanted to factor “access to public transportation” into their definition, the available data didn’t cover all of the state’s transit systems, making it impossible to compare communities by this metric. Inevitably, the method for identifying DACs will only be as true to life as the data that underlies it.
In some cases, however, there are workarounds for statistical shortcomings. While childhood lead exposure itself can’t be accurately assessed statewide, Illume pulled data on homes built before 1960, which tend to have lead paint, and is still working with the state’s Department of Health to see if there’s a more precise proxy measure.
At times, the group has also been able to use this opportunity to push the state to collect better data. Eddie Bautista, a working group member who is the executive director of the New York City Environmental Justice Alliance, has repeatedly stressed the importance of including land zoned for manufacturing in the criteria — data that exists locally but not in a statewide data set. In response, the DEC began compiling local zoning data from across the state, and the group will be able to include the metric in its definition.
After taking these steps to select their proverbial cake’s ingredients, the working group will also need to decide how to combine them all before baking their final definition.
For guidance on this step, the New York group has looked to California, which created its own definition for DACs in 2014 after launching its cap and trade program. The program requires major greenhouse gas emitters to pay into a climate investments fund, and 25 percent of the fund’s grants must go to DACs.
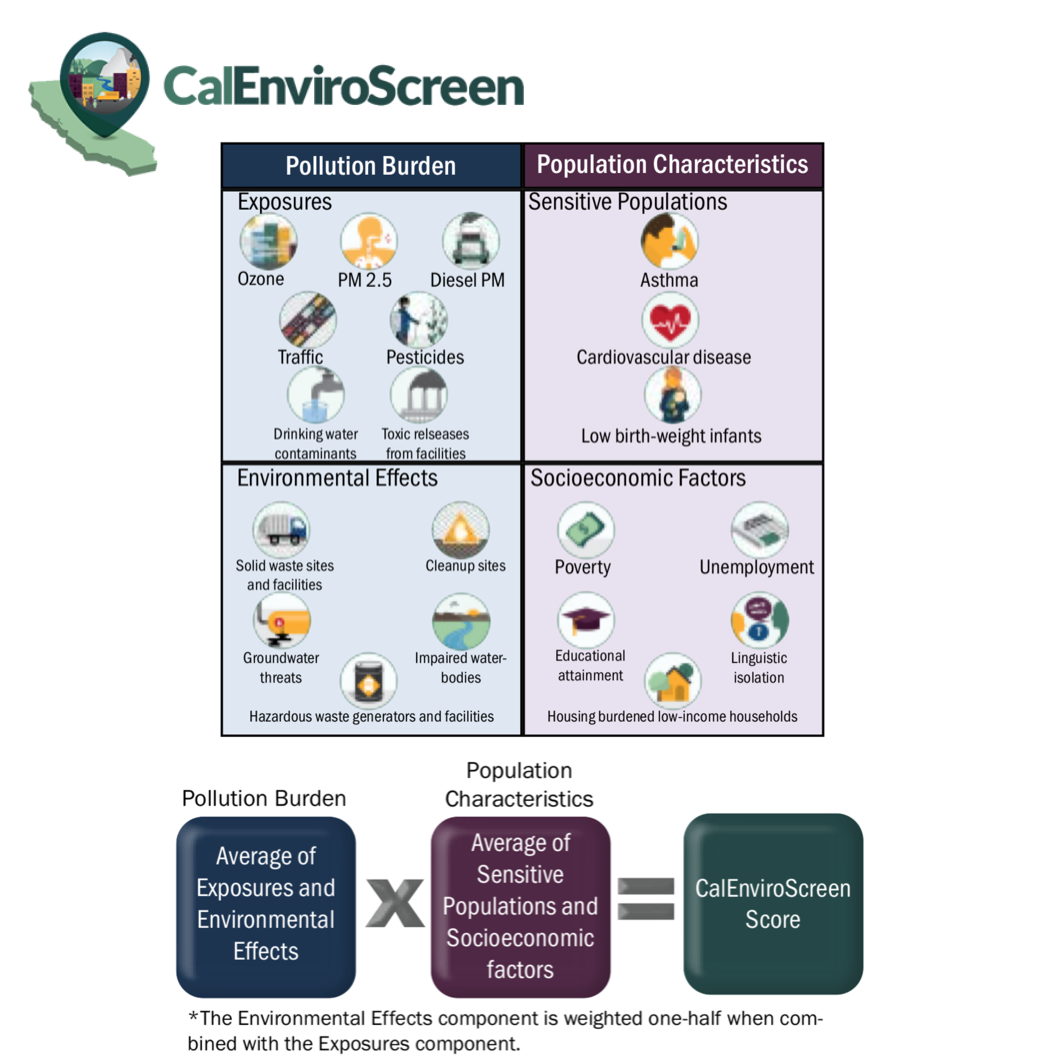
California developed its own environmental justice mapping tool, called CalEnviroscreen, which can be used to compare the cumulative burdens communities face throughout the state. The state uses that tool to identify DACs, drawing on 20 different criteria and grouping them into two main categories: pollution burden and population characteristics. An average score is calculated for each of the two categories for every census tract in the state, and then those scores are multiplied — the logic being that an individual’s socioeconomic and personal health status can exacerbate the risk of pollution exposures. For example, asthmatics are more sensitive to air pollution than non-asthmatics, and poor people tend to have less access to health care to address pollution-related illnesses.
The New York working group is leaning toward dividing its criteria into two very similar categories to be multiplied together: burdens and vulnerabilities. Burdens would include things like pollution, historical discriminatory practices like redlining, and climate change risks like extreme heat and flooding projections. Vulnerabilities would include socioeconomic factors and health issues like asthma.
There are other, more complicated ways to combine the criteria that might be warranted. For example, if the equation ends up designating DACs in an area like the Hamptons, which faces serious flooding and storm surge risks but is not vulnerable from an environmental justice standpoint, the group could double certain ingredients in the recipe, giving more weight to criteria like income or health disparities. (The median household income in Southampton is $122,000.)
Alternatively, the group could calculate scores for burdens and vulnerabilities separately, eliminate any communities that aren’t in the top percentile of both, and then combine the two scores for the remaining list and include only the highest-scoring out of those.
“There are so many little things we could be doing to guide the definition one way or the other,” said Illume managing director Alex Dunn during a working group discussion in March. “We need to be explicitly transparent about each of them.”
In addition to choosing ingredients and figuring out how to combine them, the third and perhaps most consequential step in this recipe is figuring out how to slice the cake when it comes out of the oven.
In February, Dunn presented a preliminary model identifying DACs based solely on income and racial demographics. As a result, New York City accounted for 69 percent of all DACs, despite containing just 43 percent of the state’s population. The exercise demonstrated that the sheer density of both poverty and people of color in the city are likely to lead to it being overrepresented, even after other criteria are included. Dunn suggested that the group might want to consider slicing the cake in such a way that ensured that DACs were more evenly spread throughout the state.
“Our choices here are really going to matter,” she said. “This is not something that should just be data-driven.”
One way to ensure a more even spread throughout the state would be to assign a fixed share of the DACs to New York City and an equal share to the rest of the state — for example, designating the top 25 percent of highest-scoring census tracts in NYC as DACs, as well as the top 25 percent of census tracts in the rest of the state.
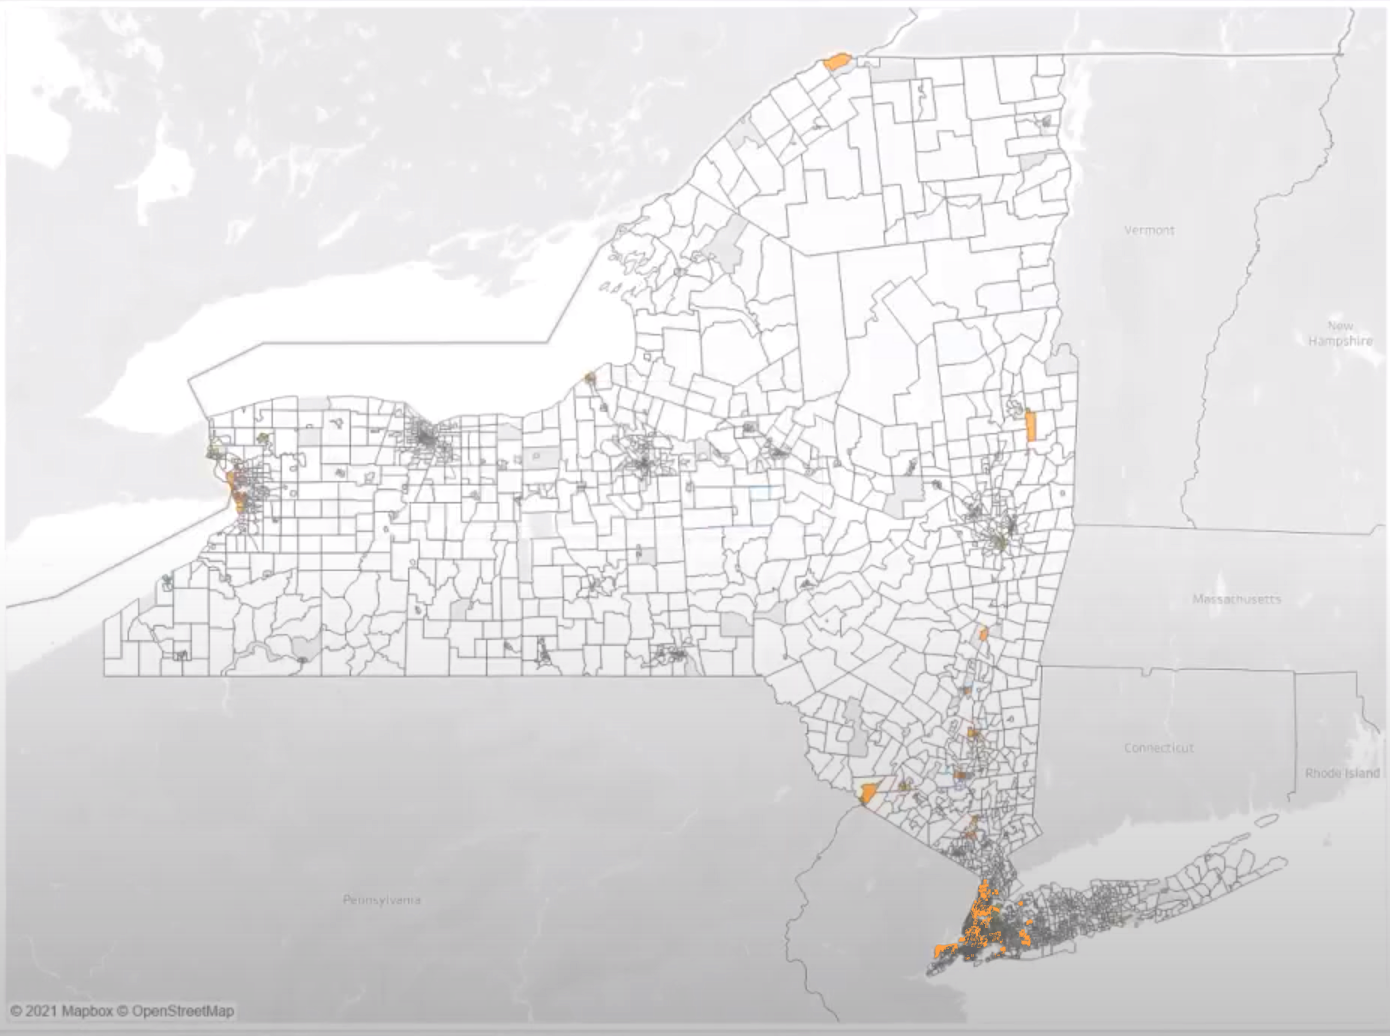
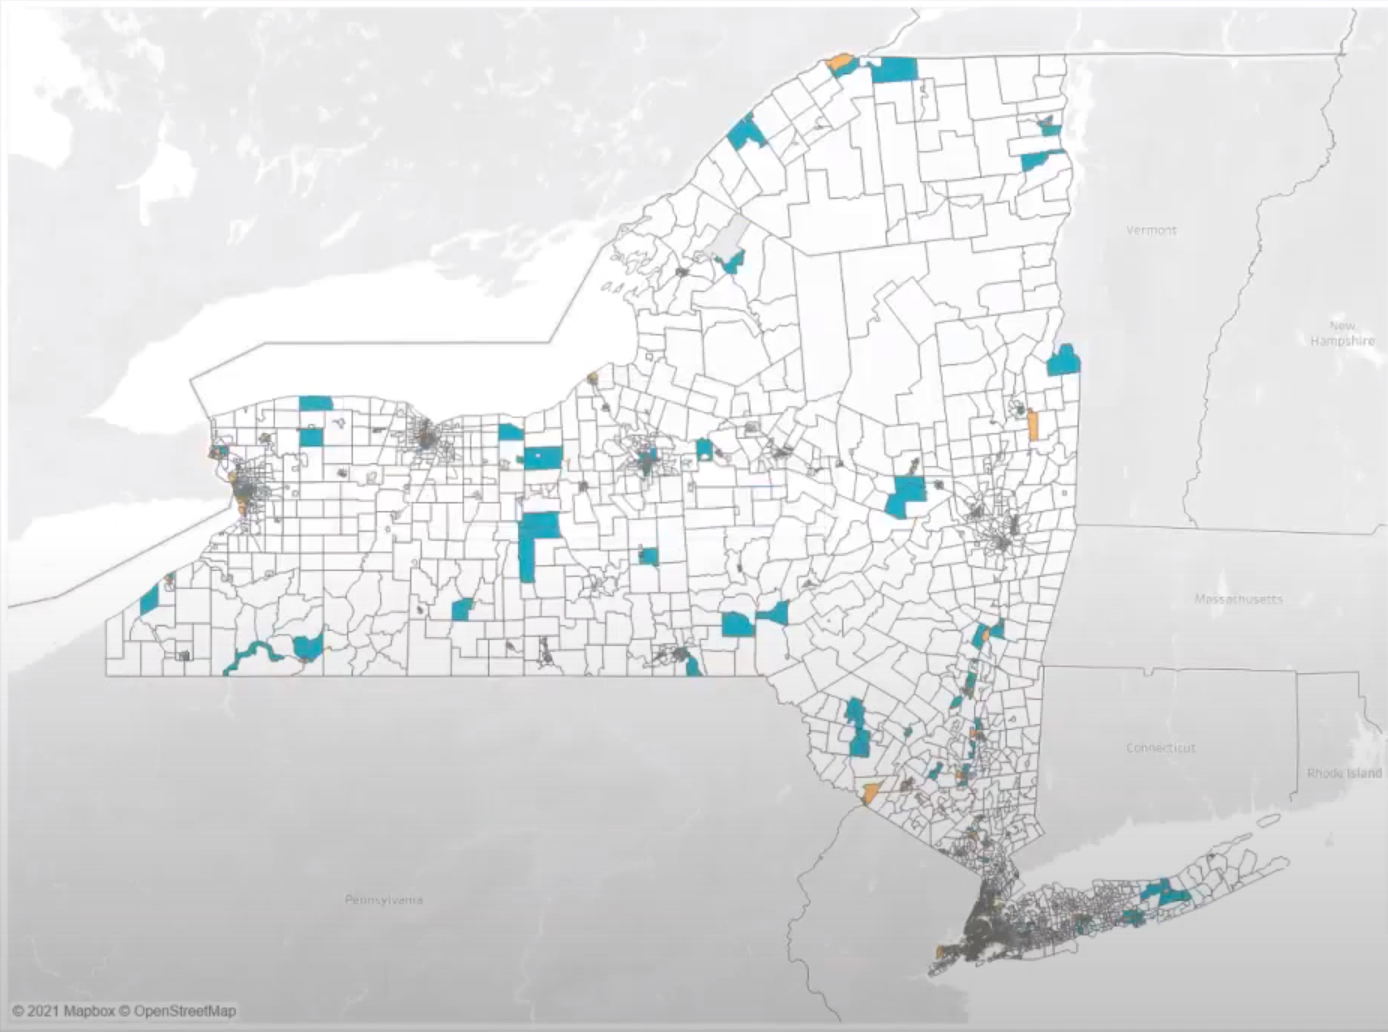
At a later meeting in April, Illume updated its preliminary model to reflect criteria beyond race and income. Dunn showed the group maps that indicated where DACs would be under two scenarios — one that strived for more regional parity, and one that just took the top scoring census tracts statewide. The difference was still stark.
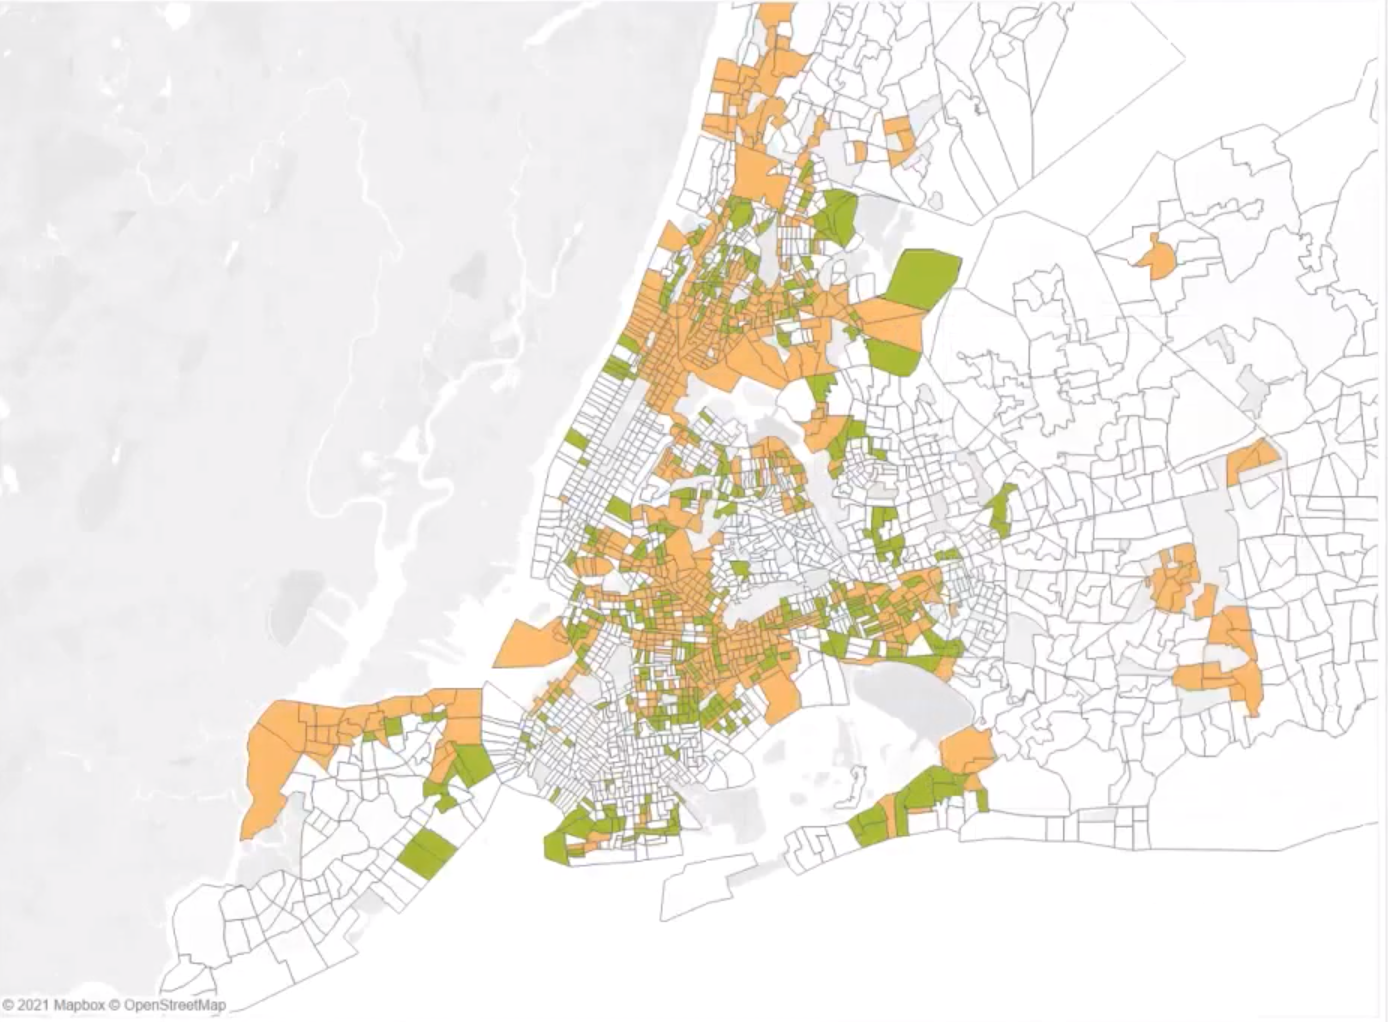
In Illume’s preliminary model for designating DACs, left, the communities are identified in orange using an approach that selects the top 25 percent of highest-scoring communities statewide. The blue markers in the map on the right represent DACs that would be added if the definition included the top 25 percent highest-scoring non-NYC communities. Illume / NYSERDA
In the meeting, Bautista wrestled with the consequences of deliberately allotting fewer DACs to his city. On the one hand, New York City has more than 1.3 million people living below the poverty line. On the other, it has more resources to meet poor communities’ needs: In 2019, New York City’s budget per capita was about $10,000. Buffalo, New York, which is one of the poorest cities in the country, had a per capita budget of just under $2,000.
But funding distribution is not the only factor to consider. By law, the state must also prioritize pollution reduction in DACs. Fewer DAC designations in New York City may make some of its neighborhoods less likely to be considered “overburdened” during permitting processes for new polluting infrastructure. In other words, in a worst-case scenario, removing them from the equation could ultimately lead to them becoming more polluted.
California, for its part, just lets the chips fall where they may, with no regional prioritization. According to a 2018 analysis by the California-based nonprofit Greenling Institute, about 50 percent of the state’s DACs are in the greater Los Angeles region. Rural central California also has a significant share of about 20 percent, due to high scores for pesticide use, poverty, and linguistic isolation, among other factors. The Bay Area, home to roughly 22 percent of the state’s population, has only about 5 percent of its DACs.
Manuel Pastor, director of the University of Southern California’s Equity Research Institute, said the regional breakdown in California can be partially attributed to both the Bay Area’s higher incomes and to wind patterns that concentrate smog in Southern California, giving the area very high pollution scores for criteria like ozone, particulate matter, and vehicle fumes. But even though the Los Angeles region is well-represented, its most vulnerable communities are not necessarily guaranteed the priority access to funding that one might expect, according to Pastor.
“You don’t have a lot of specificity about driving your resources to perhaps the most sharply exposed and socially vulnerable neighborhoods within a region,” he said, noting that some of the most heavily-burdened neighborhoods are less likely to have community organizations or nonprofit housing developers ready to apply for funding than some of the neighborhoods a little further down the list. For example, the small, mostly Latino suburb of Bell Gardens doesn’t have the same civic infrastructure as the neighborhoods that surround the University of Southern California. Both areas include DACs, but they’re not on equal footing when it comes to obtaining funding.
Alvaro Sanchez, vice president of policy at the Greenlining Institute, said that the state’s grant programs historically have been geared more toward urban environments at the expense of more rural DACs. Greenlining found that as of 2018, the Bay Area had received about 22 percent of the state’s climate investments from the cap and trade program despite only hosting 5 percent of all DACs, while the Central Valley had only received about 8 percent, despite hosting twice that share of the state’s DACs.

These examples underscore the reality that any policy meant to distribute resources to marginalized communities is going to depend on how it is administered as much as it will depend on the initial policy design. Environmental justice advocates often stress that it’s not enough for states to make funding available to disadvantaged communities, who may not have the time or resources to figure out how to apply for it — or even know that it exists. Agencies need to actively reach out to communities and provide planning resources and technical assistance.
“How are you thinking about how you’re going to be communicating with frontline communities?” Rahwa Ghirmatzion, executive director of a Buffalo-based community organization, asked a DEC staff member during a working group meeting. “How are communities deciding for themselves what they want and need?”
These implementation concerns are outside the scope of the definition, but there’s a more pertinent question that will help determine how much access any given community has to funding opportunities: Just how big is this cake going to be? Once there’s a set list of criteria and a method for scoring every census tract based on that criteria, what should the cutoff be for assessing communities’ scores? Out of New York’s 4,918 census tracts, just how many should be considered disadvantaged?
The reason New York environmental groups lobbied for the 40 percent provision in the first place is that about 41 percent of the state’s population are people of color, and 43 percent of the population earns less than $50,000 per year. But let’s say the cutoff for who gets designated a DAC ends up capturing only a third of the population. In theory, that would mean that the state’s neediest could receive a greater share of the benefits: 35-40 percent of the benefits would be guaranteed to the most disadvantaged third of the population. If more census tracts are included in the model, the amount of benefits available to any given DAC could shrink. (New York’s climate law says the goal is for DACs to receive 40 percent of benefits, but it requires that DACs receive “no less than 35 percent.”)
California, for its part, decided to designate the top 25 percent of its highest scoring census tracts (which include 25 percent of the state’s population) to be “disadvantaged” after doing extensive public engagement on the question. State agencies held regional workshops where they showed people maps and charts of what it would mean if 20, 25, and 30 percent of the population were designated DACs. Ultimately, while a threshold of 20 percent was considered to concentrate funding on areas most in need, concerns that it was excluding key communities won out, and 25 percent was chosen.
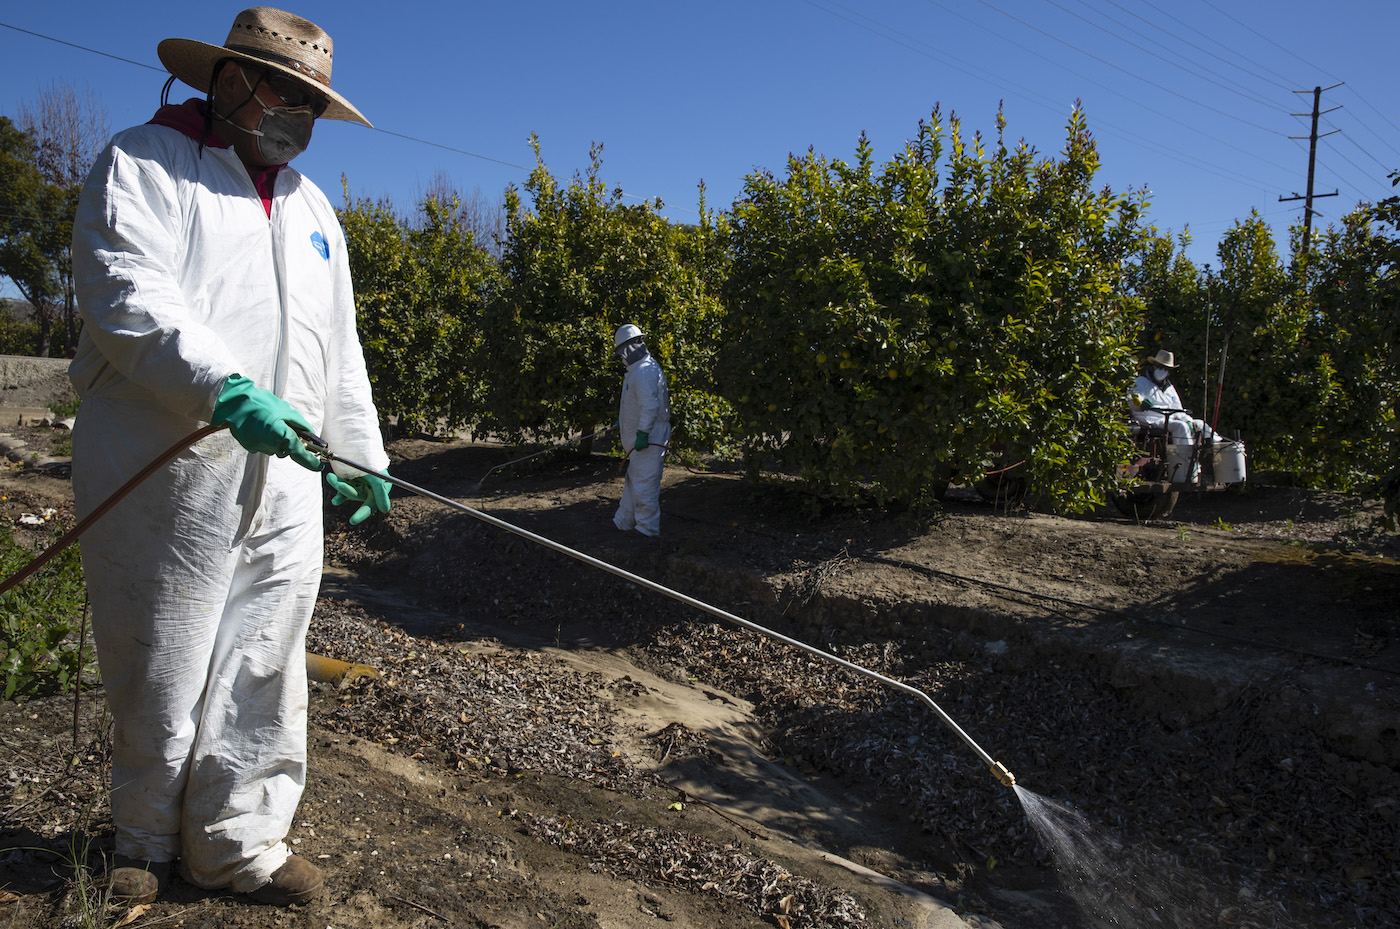
But while that sounds like all it does is ensure that DACs receive benefits in proportion to their share of the population, a recent report on California’s program advertises that nearly 50 percent of the funds disbursed since the program’s inception have benefitted “priority populations.”
How New York State plans to define and calculate the “benefits of investments” is still an open question, but it’s possible that 35-40 percent will end up being a floor, not a ceiling.
For now, the working group may have to accept the fact that they might not get everything right the first time. But any weaknesses in the definition don’t have to be set in stone.
“One thing that I would just really emphasize for both the New York example and what’s happening here in California is that this is an iterative tool,” said Sanchez of the Greenlining Institute. “It’s consistently getting upgraded.”
Another lesson from California is that the question of identifying disadvantaged communities is not just about one stream of funding. Once New York has a screening tool in place with the ability to map different data across the state, it can use that data for a wide variety of programs. Diane Takvorian, executive director of the Environmental Health Coalition, told the working group that ever since CalEnviroscreen was first built to evaluate cumulative environmental burdens, it has been integrated into more than a dozen pieces of legislation and regulations at the state and local level.
“If the framework for identification for the most impacted communities is solid, you can build a series of legislative pieces that go with it to attack the problems most important in your communities,” she told the New York working group in March.
While the stakes of determining which communities get designated “disadvantaged” and which don’t seem high, Bautista frequently reminds his fellow working group members that the definition will not, on its own, exclude any community from receiving state funding.
“If communities are not disadvantaged at the end of this process, that doesn’t mean that they are not going to be eligible for funding,” Bautista reminded the group during one of the discussions about regional parity. “There’s 60 percent of the rest of the funding that’s going to be up for grabs. We’re talking about targeting the funding.”
