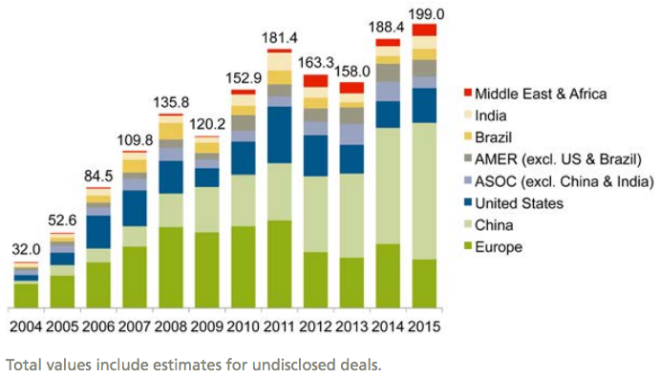
Today, you’ll see some headlines touting last year’s record investment in renewables. A new report from the Frankfurt School–UNEP Centre and Bloomberg New Energy Finance shows investment in clean energy grew to $286 billion globally in 2015 — a new world record! — up 5 percent from the previous year. Here’s what the global trend in renewable investment looks like since 2004:
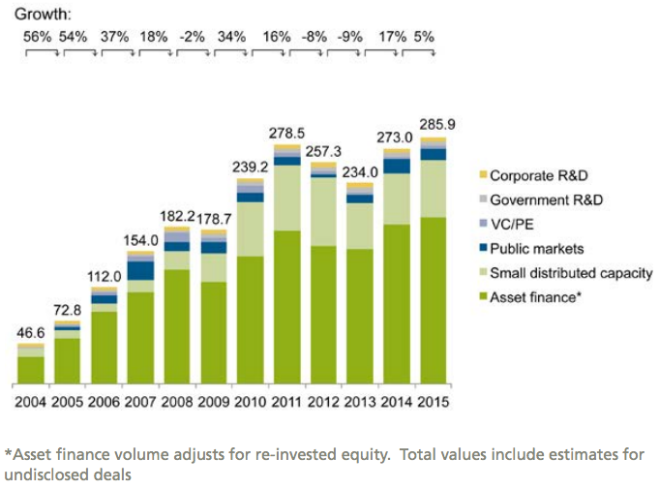
Global new investment in renewable energy by asset class, 2004–2015, $bnUNEP, Bloomberg New Energy Finance
As a whole, investment in renewable capacity was more than twice that invested in coal- and gas-fired projects last year, and new clean generating capacity added was greater than all other kinds of new generating capacity combined. Note that coal and gas only make up about a third of the pie chart below:
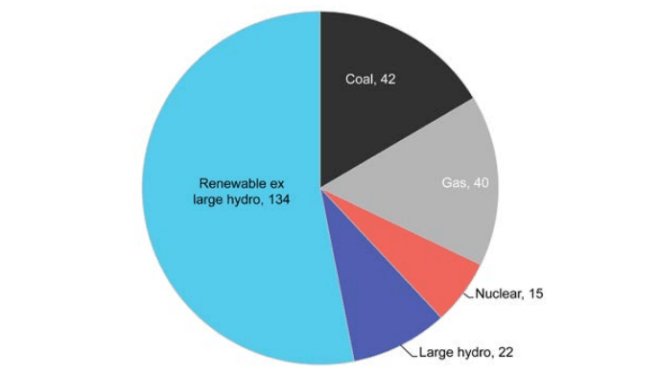
New power generating capacity added in 2015 by main technology, gigawattsBloomberg New Energy Finance
But it would kind of be bonkers if that weren’t the case.
Investment in new renewable generating capacity has had a rocky history, but it has more or less been rising everywhere except Europe for the past decade. (Europe has notably seen a decline in investment since about 2011.)
Still, total global renewable capacity — not just newly added renewable capacity — continues to make up just a small fraction of the energy mix. Total clean energy capacity grew to 16.2 percent of the global mix in 2015, an increase from 15.2 percent in 2014. Actual electricity generated by renewable sources (excluding large hydroelectric projects) grew to 10.3 percent. It’s encouraging growth, to be sure, but perhaps not the sunny picture painted by the phrase “new world record.”
Zooming the lens in a bit reveals a more interesting story. “There are so many numbers, it’s difficult to wrap them up in a few remarks,” cautioned Angus McCrone, lead author and chief editor on the report, on a press call. Indeed, there’s a lot going on in the UNEP report, but one of the things it does well is shine a shaft of light between the big numbers. Who, exactly, is spending all this money, and what kind of money are they spending? China — whose just-released Five-Year Plan has been heralded as its greenest ever — is pouring money into new renewable projects. But what kind of projects are we actually talking about?
China was No. 1 in renewable investment in 2015, responsible for 36 percent of the world’s total. Europe came in second; even its continued slide in investment left it with $4 billion more pumped into the renewable sector than the United States. Here’s the regional breakdown, in billions of dollars, of spending on renewables in 2015:
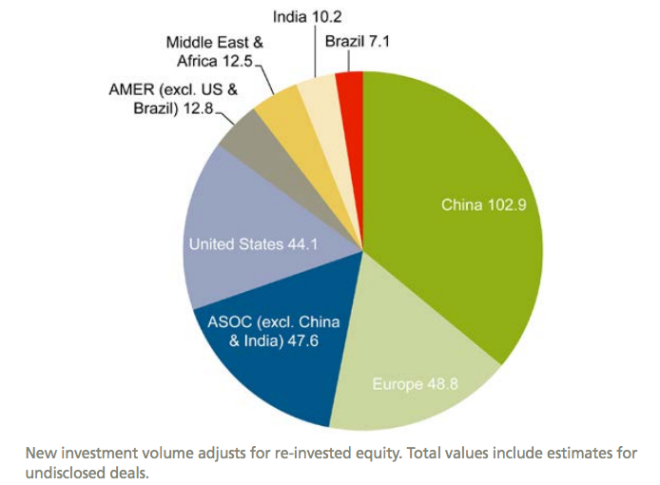
Global new investment in renewable energy by region, 2015, $bnUNEP, Bloomberg New Energy Finance
That’s not the whole story, though. While China experienced 81 percent growth last year in new small distributed capacity (solar projects with a capacity of less than 1 megawatt), Japan still smashed the rest of the world in that sector. In the bar graph below, note that even with declining investment in small distributed capacity, the U.S. still finished in second:
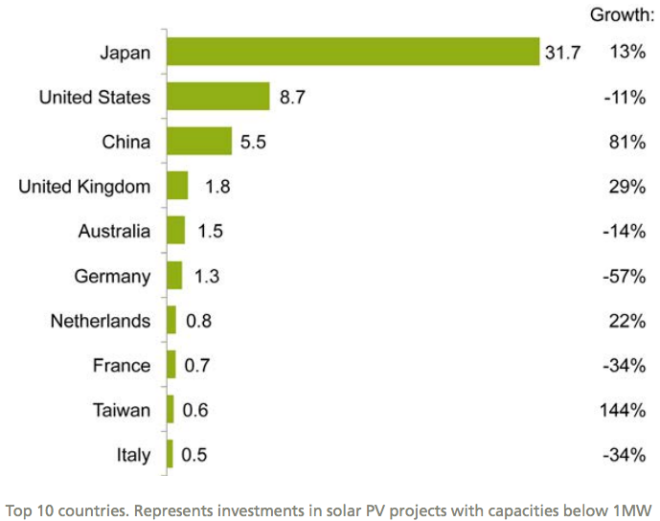
Small distributed capacity investment by country, 2015, and growth on 2014, $bnUNEP, Bloomberg New Energy Finance
China commissioned around 29 gigawatts of onshore wind capacity in 2015 and installed close to 16 GW of solar PV projects. The country’s investments are largely dominated by company borrowing for and spending on renewable projects: what UNEP calls asset finance. Asset finance mostly consists of what’s on company balance sheets, as well as loans and equity financing. Europe, too, invested more than the U.S. in terms of asset finance last year. Here’s the breakdown of how countries invested their renewable dollars in 2015:
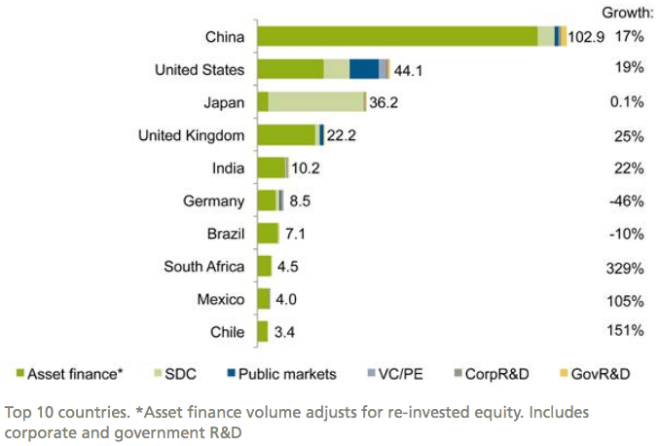
New investment in renewable energy by country and asset class, 2015, and growth on 2014, $bnUNEP, Bloomberg New Energy Finance
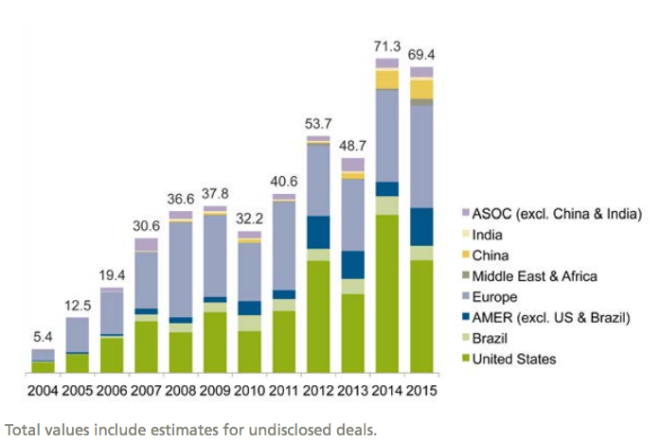
So the UNEP report helps clarify the role China plays in the renewable sector: It’s mostly deploying utility-scale projects, and they’re mostly projects that are ready for asset finance. Globally speaking, though, here’s what asset finance for renewables looks like over time and space:
Asset finance investment in renewable energy by region, 2004–2015, $bnBloomberg New Energy Finance, UNEP
But asset finance comes relatively late in a renewable project’s life cycle; that is, at the point of roll-out. Earlier in the cycle, though, the funding landscape looks a little different. Funding from public markets, for example, might begin to trickle in at the point when a given company scales up manufacturing. The United States, which leads the world in terms of investment in publicly listed renewable companies, saw a 41 percent increase in this kind of funding in 2015, compared to the previous year. Note China’s 45 percent dip in this area in the following chart:
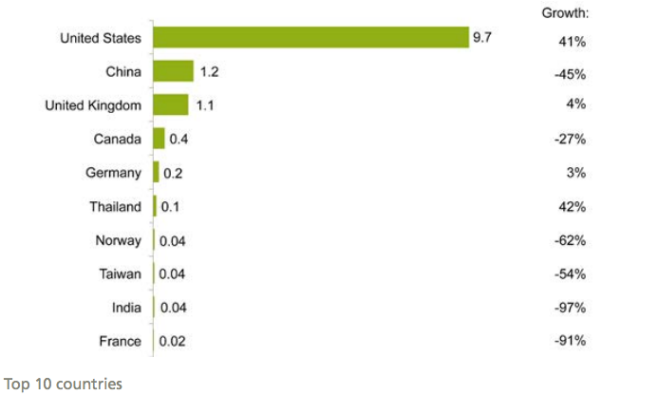
Public markets investment in renewable energy by company nationality, 2015, and growth on 2014, $bnBloomberg New Energy Finance
In terms of venture capital and private equity — the kind of investment that comes at an earlier stage in a company’s cycle — the United States also boasted the heaviest spend. Here’s the global distribution of venture capital spending since 2004, broken down by region:
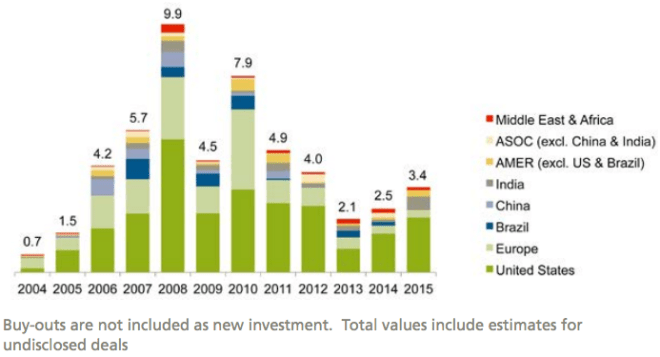
Venture capital/private equity investment in renewable energy by region, 2004–2015, $bnBloomberg New Energy Finance, UNEP
And the U.S. was responsible for more value in terms of mergers and acquisitions (including refinancings, takeovers, and buy-outs) in the renewables space than any other country last year. As the following chart shows, while China has seen modest growth in acquisitions over the past couple years, the country still makes up only a small chunk of total spending in this space:
Asset acquisitions and refinancings by region, 2004–2015, $bnBloomberg New Energy Finance
None of this is particularly surprising, but it is illuminating — and in many cases, sobering. Don’t forget that China brought more than 40 GW of coal and gas power online last year, too. Investment in the renewable sector continues to grow, but if countries are serious about the commitments they made at the Paris Climate Conference, they’ll have to wean themselves off fossil fuels a lot faster. “When you’re on a diet, it’s not enough to count the salads you’re eating,” said Ulf Moslener, lead editor on the report, on a press call. “You also have to account for the ice cream.”