
Everyone knows that Americans don’t eat very well, but it’s still kinda staggering to see just HOW bad things have gotten. To wit: The recommended maximum dosage of sugar in the average diet is under four teaspoons for every 1,000 calories, whereas we consume a whopping 9.5. Since Americans are also bad at math, I’ll restate: That’s MORE THAN TWICE AS MUCH!!!
Average density of added sugars, 2007-10 (tsp per 1,000 calories)
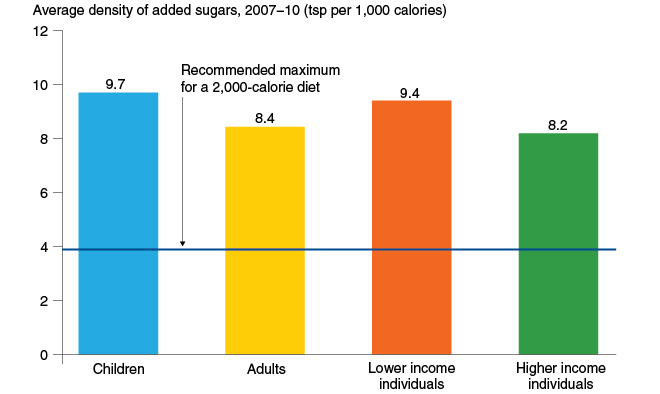
Lower income individuals had household incomes at or below 185 percent of the poverty threshold and higher income individuals had incomes above 185 percent.Source: USDA, Economic Research Service, Food Consumption and Nutrient Intakes data product.
While lower income individuals and children do particularly poorly, thanks to a rigged food system, no one on that chart is exactly winning. And when it comes to the fat of the land, well, we’re scarfing that, too. The USDA recommends no more than 8.5 grams of added fat for every 1,000 calories; we actually eat 18.5.
Meanwhile, vegetables are getting some serious short shrift; on average, an American only manages to cram down half the recommended servings of green and orange veggies every day, with children and lower income people at the bottom of the distribution.
Lower income Americans’ diets contain fewer dark green, red, and orange vegetables than higher income Americans
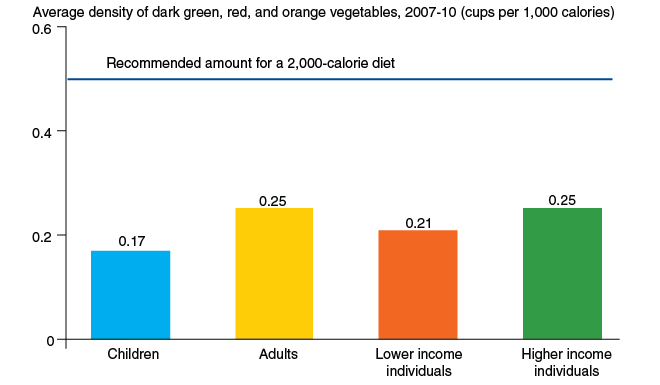
Lower income individuals had household incomes at or below 185 percent of the poverty threshold and higher income individuals had incomes above 185 percent.Source: USDA, Economic Research Service, Food Consumption and Nutrient Intakes data product.
I guess we’re not failing at everything: The USDA points out that AT LEAST school-aged children are meeting our goals on dairy … but, well, you know how we feel about cows.
School foods provide the highest dairy product density among all food sources in children’s diets
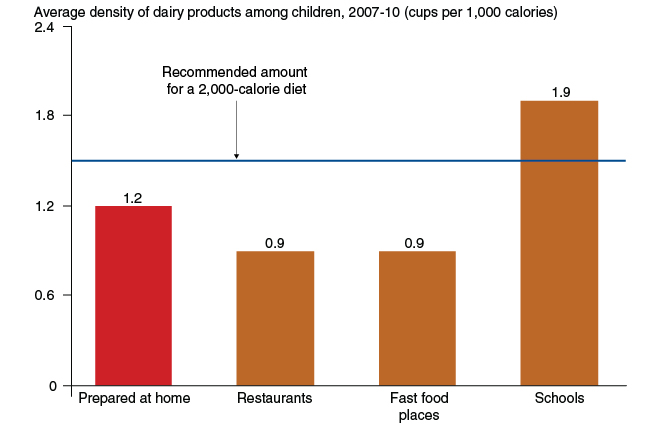
Source: USDA, Economic Research Service, Food Consumption and Nutrient Intakes data product.
With all of this in mind, perhaps it’s time to take some advice from the FLOTUS — more dancing and root vegetables, less of everything else.
[protected-iframe id=”597f54e878a38db6059529fa9df8cef5-5104299-57007830″ info=”https://vine.co/v/OqJKZVQami9/embed/simple” width=”660″ height=”660″ frameborder=”0″]