As this hottest-on-record, godforsaken decade draws to a close, it’s clear that global warming is no longer a problem for future generations but one that’s already displacing communities, costing billions, and driving mass extinctions. And it’s worth asking: Where did the past 10 years get us?
The seven charts below begin to hint at an answer to that question. Some of the changes they document, like the concentration of carbon dioxide in the atmosphere and the number of billion dollar disasters that occur each year, illustrate how little we did to reduce emissions and how unprepared the world is to deal with the warming we’ve already locked in. Even though more people believe in human-caused climate change now than 10 years ago, a growing chasm in political partisanship makes it more difficult than ever for Congress to pass climate legislation.
But by other measures, we might one day look back on the 2010s as a turning point in our civilization’s approach to climate change. The growth of renewable energy and rapid retirement of coal-burning power plants this decade illustrate that crucial changes to the world order are currently well underway.
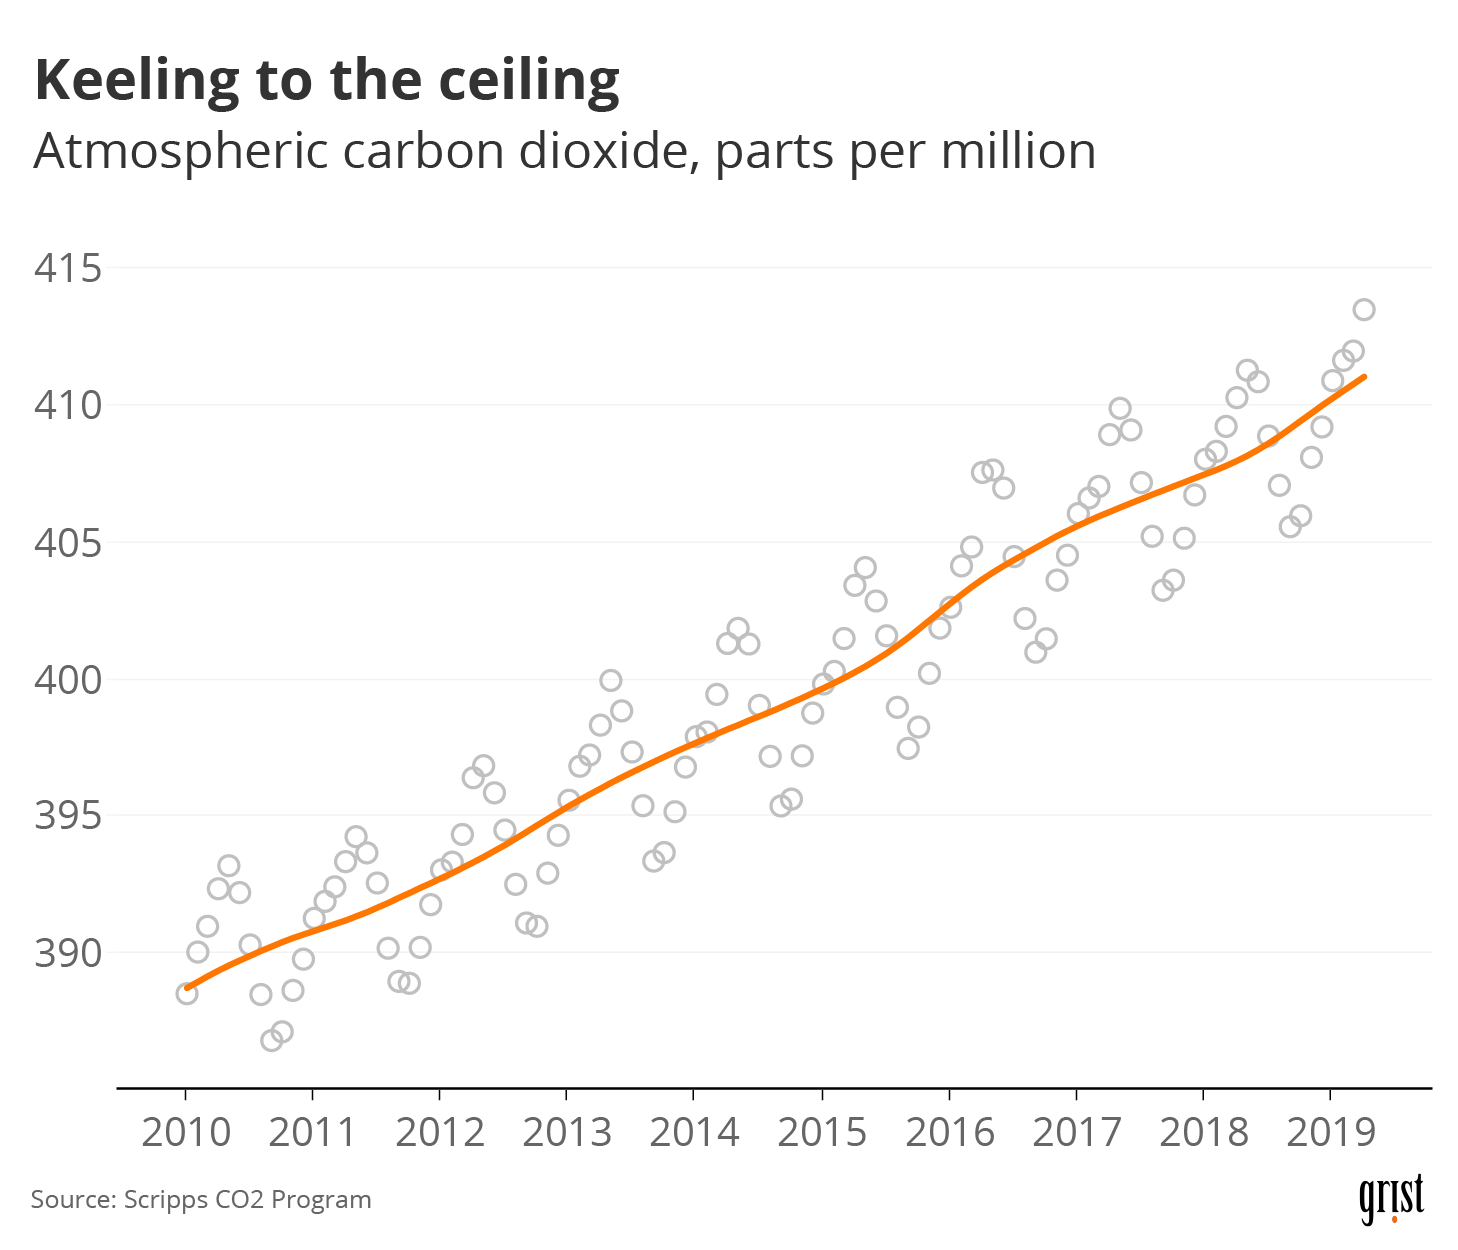
1. Atmospheric carbon dioxide rose by about 25 parts per million.
Clayton Aldern / Grist
Let’s start with the big picture, which is to say: the bad news. The concentration of carbon dioxide in the atmosphere has not only continued to rise over the past 10 years, but it is also now rising at a faster rate than ever before.
In 2013, the famous atmospheric carbon monitoring station on Mauna Loa, first installed by Charles David Keeling in 1958, measured levels above 400 parts per million for the first time ever. By 2016, that number became the annual low. The earth’s atmosphere has not contained this much carbon dioxide in millions of years — since before Homo sapiens walked the earth. And unless we find some way to suck carbon out of the atmosphere, the Keeling curve will not dip below 400 parts per million again in your lifetime, your children’s lifetime, or their children’s lifetime, because carbon dioxide can hang around in the atmosphere for hundreds of years.
The Intergovernmental Panel on Climate Change has estimated that in order to limit planetary warming to 1.5 degrees, we can’t let atmospheric CO2 concentrations rise above 430 parts per million. Based on current trends, we only have about another 10 years left to transform our energy system before we blow right past that number as well.
2. Climate change got expensive.
Clayton Aldern / Grist
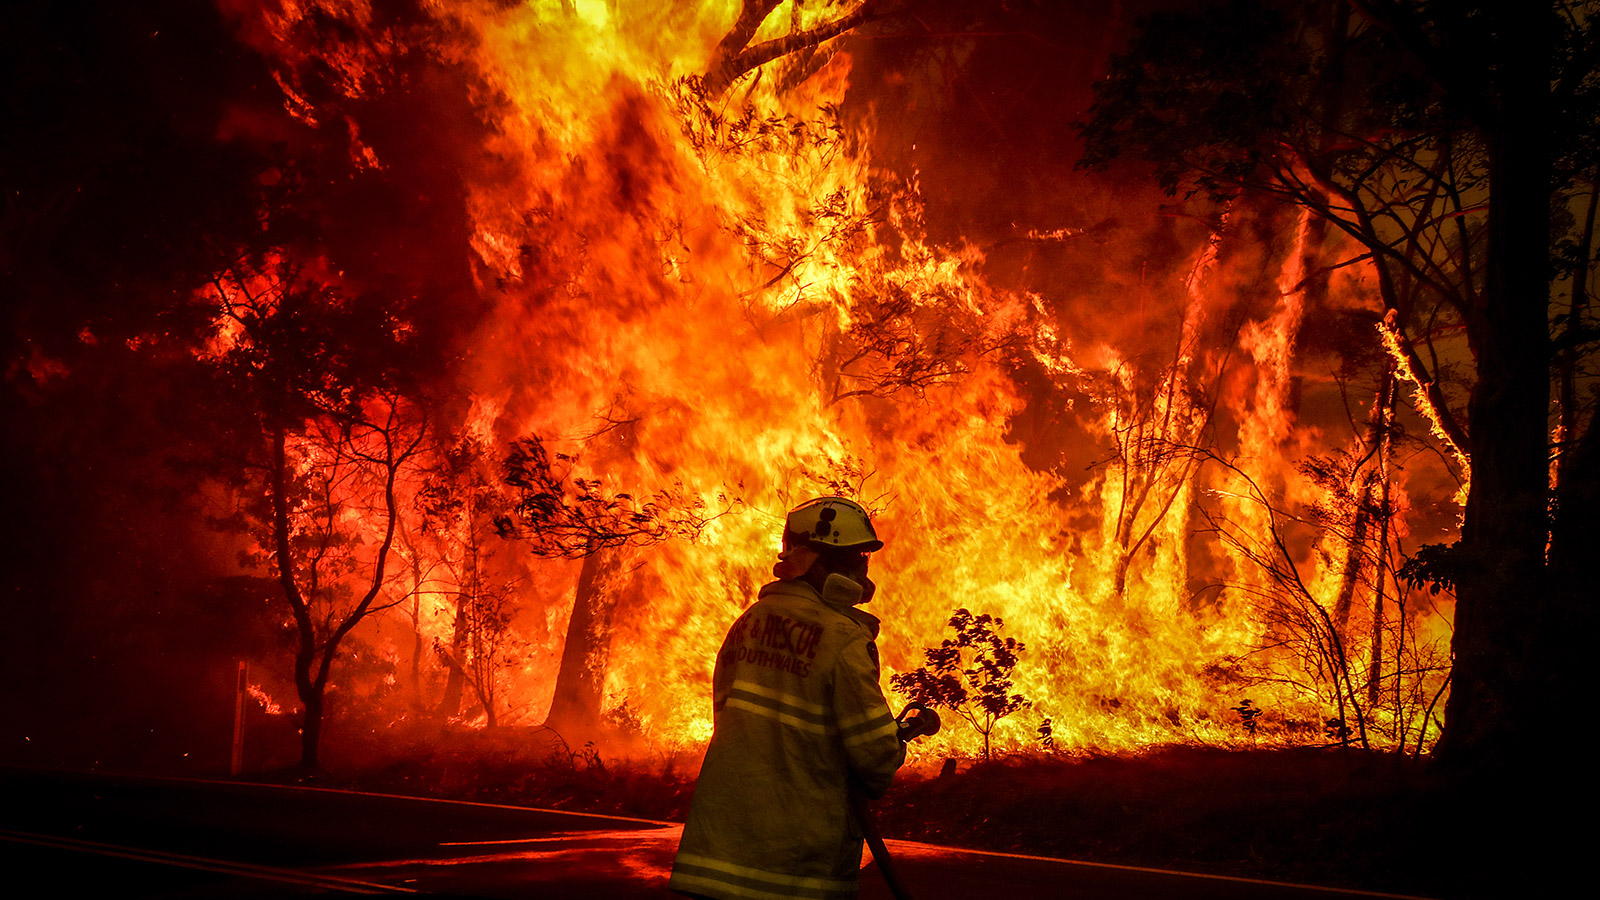
One of the best-established consequences of global warming is that it makes natural disasters, like fires and floods, more frequent and severe. In the 2010s, the costs of this consequence came into sharp focus as billion-dollar disasters struck the United States again and again. Hurricanes Irene and Sandy pummeled the Northeast, Maria forever changed Puerto Rico, Florence shook up North Carolina, and Harvey drowned Houston, Texas just weeks before Irma sank Florida. Super Typhoon Yutu, the worst storm to hit U.S. soil since 1935, wreaked havoc on the northern Mariana Islands in the Philippines. There was record flooding in the Midwest and Californians were struck by some of the largest and most destructive fires the Golden State has ever seen.
If there’s an upside to any of this, it’s that these storms disrupted the status quo. The massive expense, destruction, and displacement they brought may be prompting people to question why these storms seem worse than ever before, to consider moving to higher ground (or to Buffalo), or to demand adaptation and mitigation measures in their hometowns.
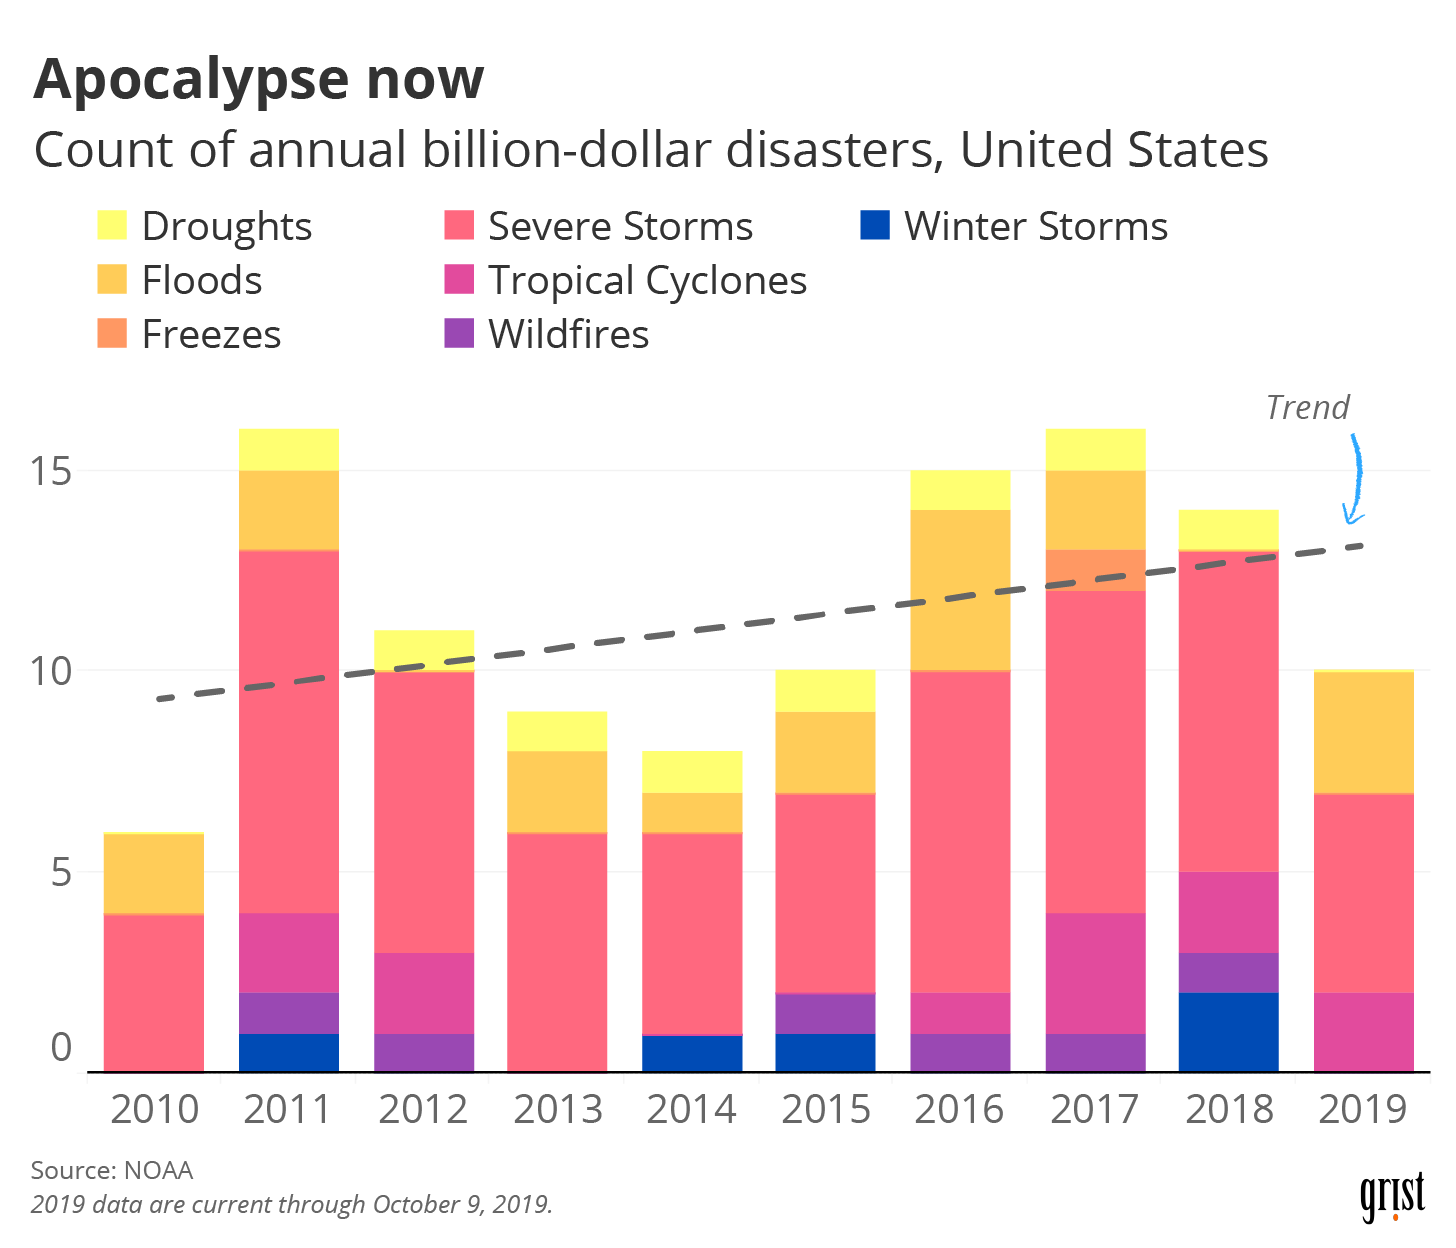
3. More people accept the basic premises that it’s getting hot and that it’s our fault.
Clayton Aldern / Grist
When it comes to climate change, there’s plenty to argue about. Should we open new nuclear plants? Would a carbon tax work? Does cap and trade have a net benefit? But if there are two things that nobody should be arguing about, they’re the facts that the planet is getting hotter, and that it’s because of human activity.
Among scientists, that score was settled a long time ago. But for some reason, the average Joe has taken a lot longer to come around to the idea … some reason that probably has a lot to do with the billions of dollars spent by fossil fuel companies to seed skepticism about the science of climate change and then muddy the waters around what we should do about it. There will always be skeptics and conspiracy theorists, but this decade, we’ve seen more and more Americans come to accept the basics of climate science, which could translate into more political will to take action in the 2020s.
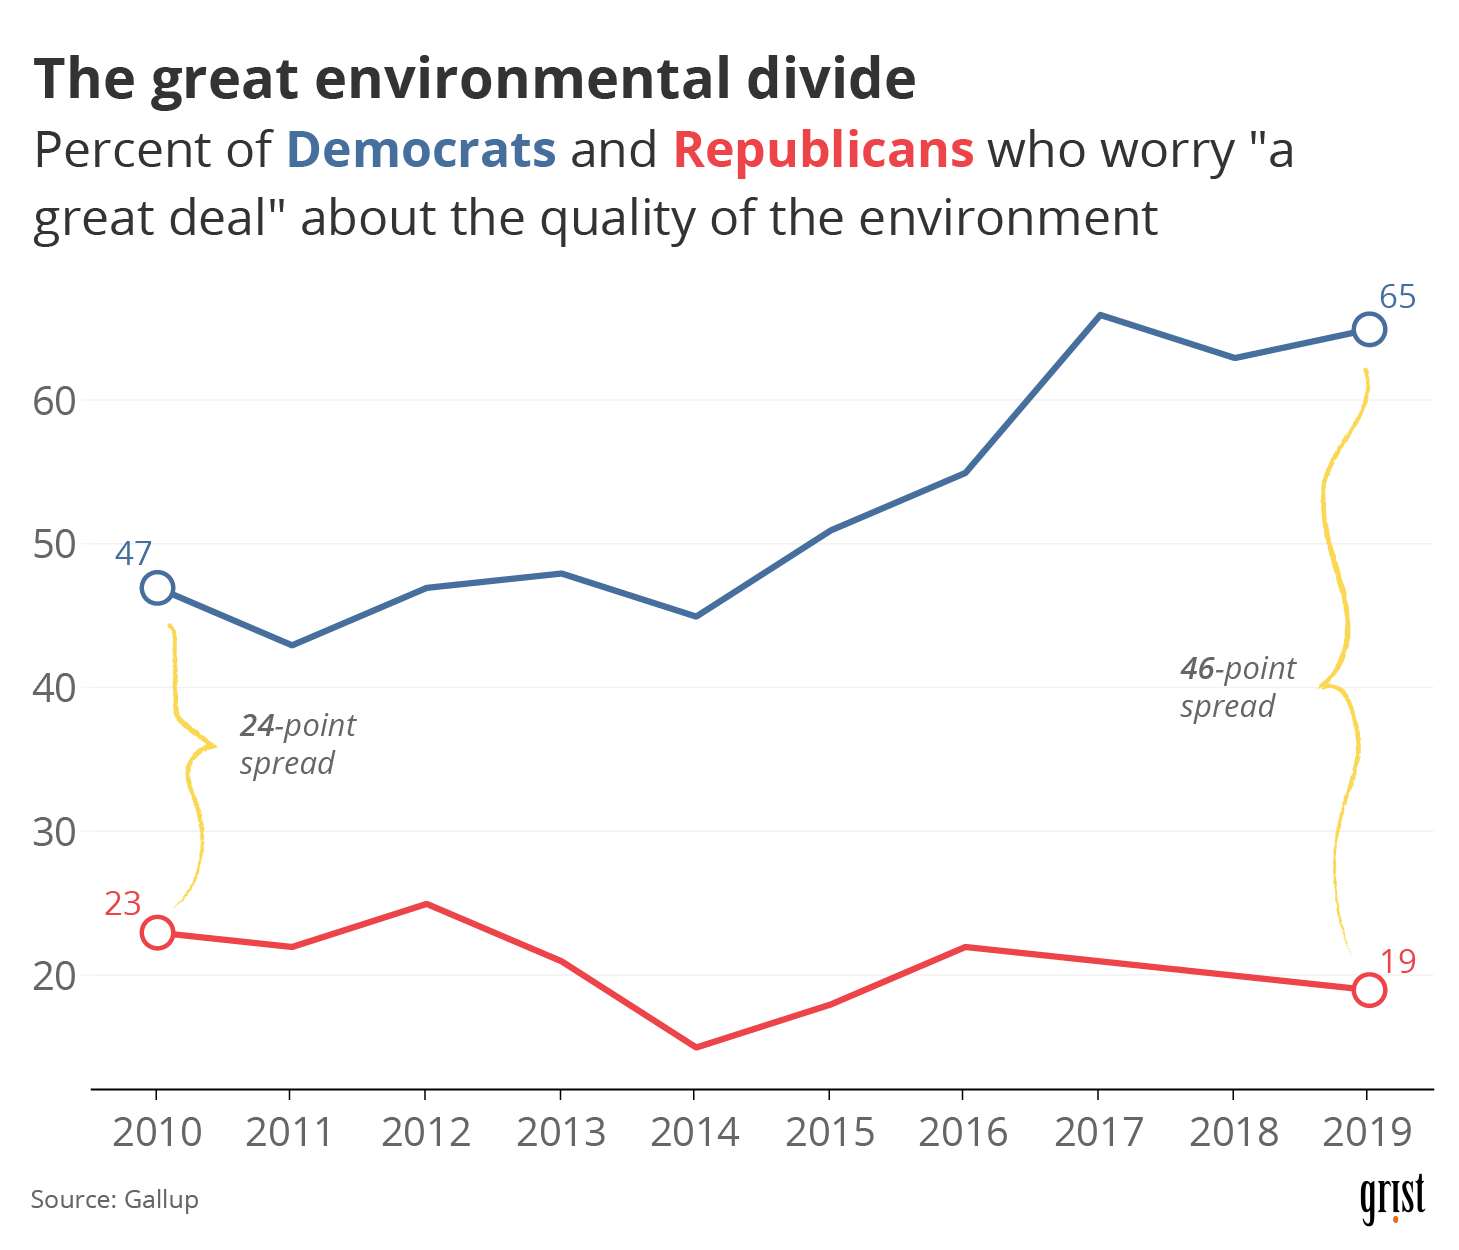
4. But there’s a widening partisan divide when it comes to worrying about the environment.
Clayton Aldern / Grist
In 2008, Nancy Pelosi and Newt Gingrich sat on a couch together and proclaimed, “Our country must take action to address climate change.” Three years later, Gingrich would write off the bipartisan television spot as “probably the dumbest single thing I’ve done in recent years.” What happened?
The short answer is: polarization. As audiences siloed themselves away in fortified partisan media towers and conservatives balked at the theoretical price tag of climate action — or came to see the climate movement as a liberal ploy to usher in an era of big government — this decade saw the twisting of environmentalism writ large into a dramatically polarizing issue. Today, one’s environmental positions in the United States are nearly as predictive of political party affiliation as one’s views on gun control and race.
With a new decade before us, a U.S. presidential election on the horizon, and ever-increasing urgency to act on climate change, the current hyperpolarization of the issue promises to prove a challenge to the collective action we’ll need.
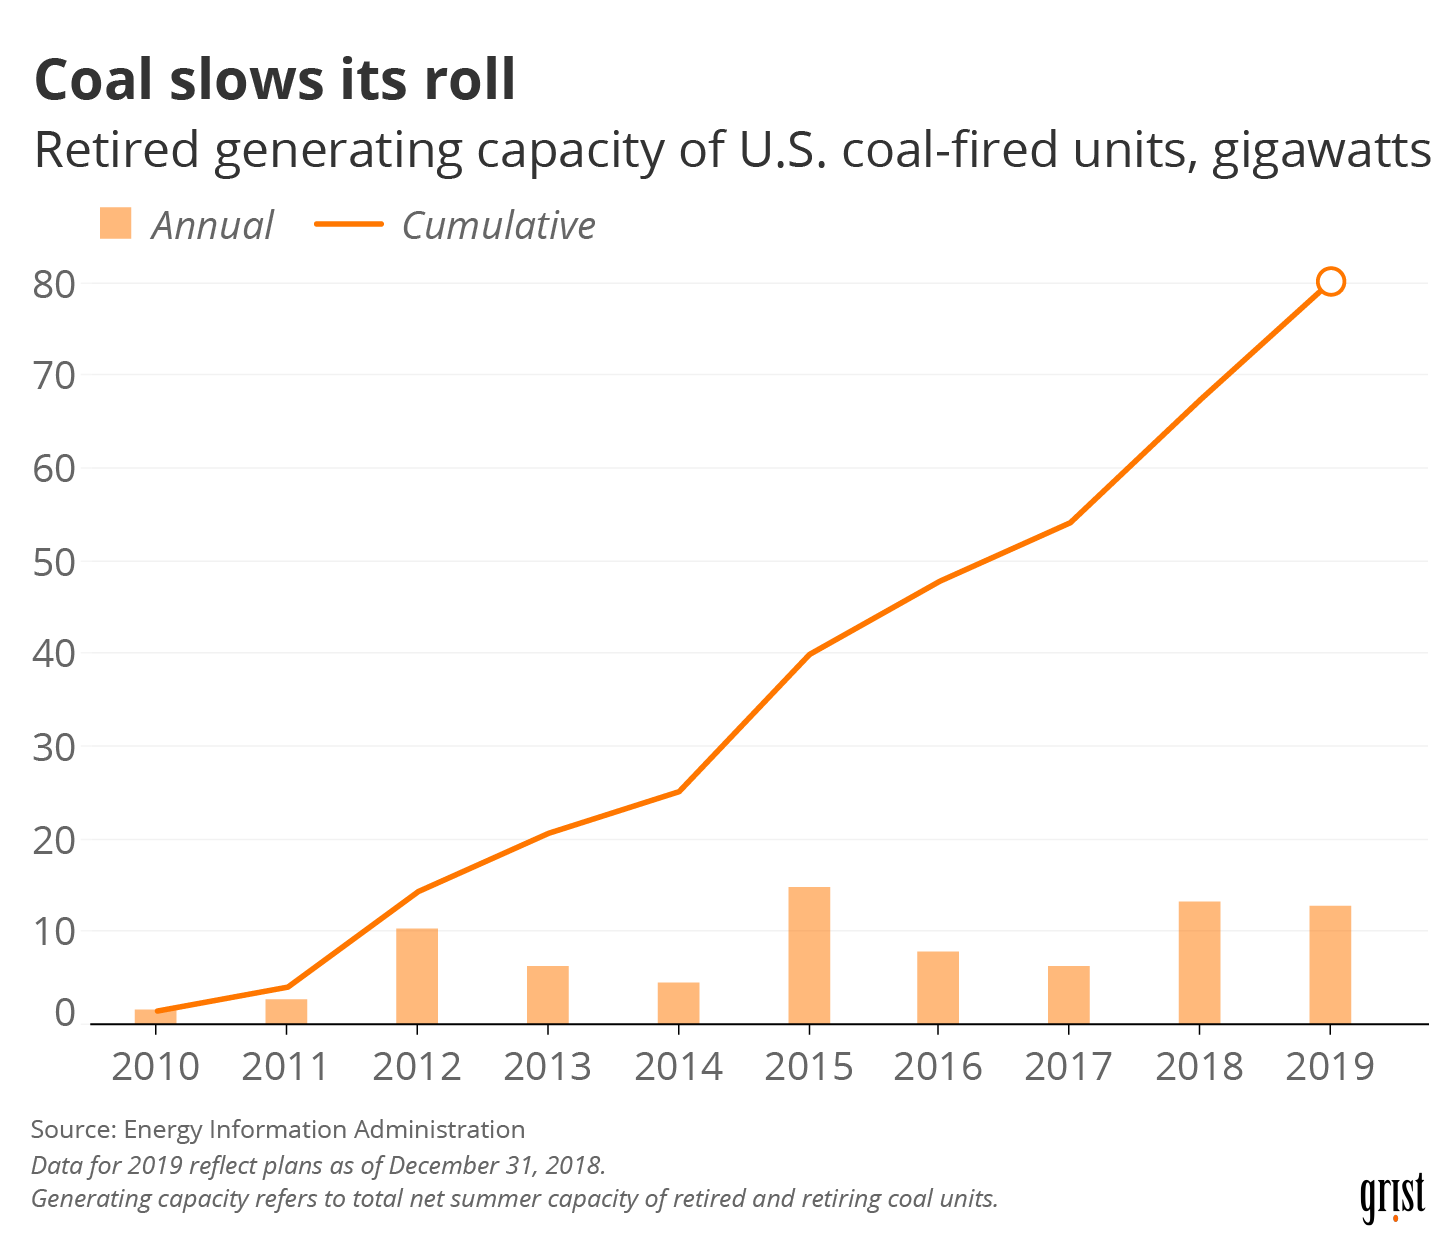
5. Coal continued its death spiral.
Clayton Aldern / Grist
Even though there was no slowing of the Keeling curve’s relentless climb this decade, the mix of sources producing all of that atmospheric carbon on the ground changed quite a bit. Coal-fired power plants, easily the most polluting and carbon-intensive source of energy at our disposal, saw a major decline this decade. From 2000 to 2009, the total generating capacity of coal-fired power plants taken offline in the United States was 6 gigawatts. From 2010 to 2019, that number jumped to 80 gigawatts — enough to power about 43 million homes.
Coal’s downfall is complicated, owing more to the fracking boom and the rise of a cheap alternative in natural gas than to environmental regulations or clean energy policy. In 2016, natural gas surpassed coal as the number one source of electricity generation in the U.S. for the first time. Burning natural gas emits about half as much carbon dioxide as coal, but those gains are diminished by the unknown quantity of methane leaking from other parts of the natural gas lifecycle.
Coal’s downward trend was not just a U.S. phenomenon. This year coal was on track to see its biggest decline yet around the world. But again, it’s complicated. Other recent reports have found that coal’s death spiral may in fact look more like an arrow pointing to Asia. Coal capacity in China and India grew over the past 10 years. The decisions these two countries make about their energy mix in the next decade will determine how much we are able to limit overall warming.
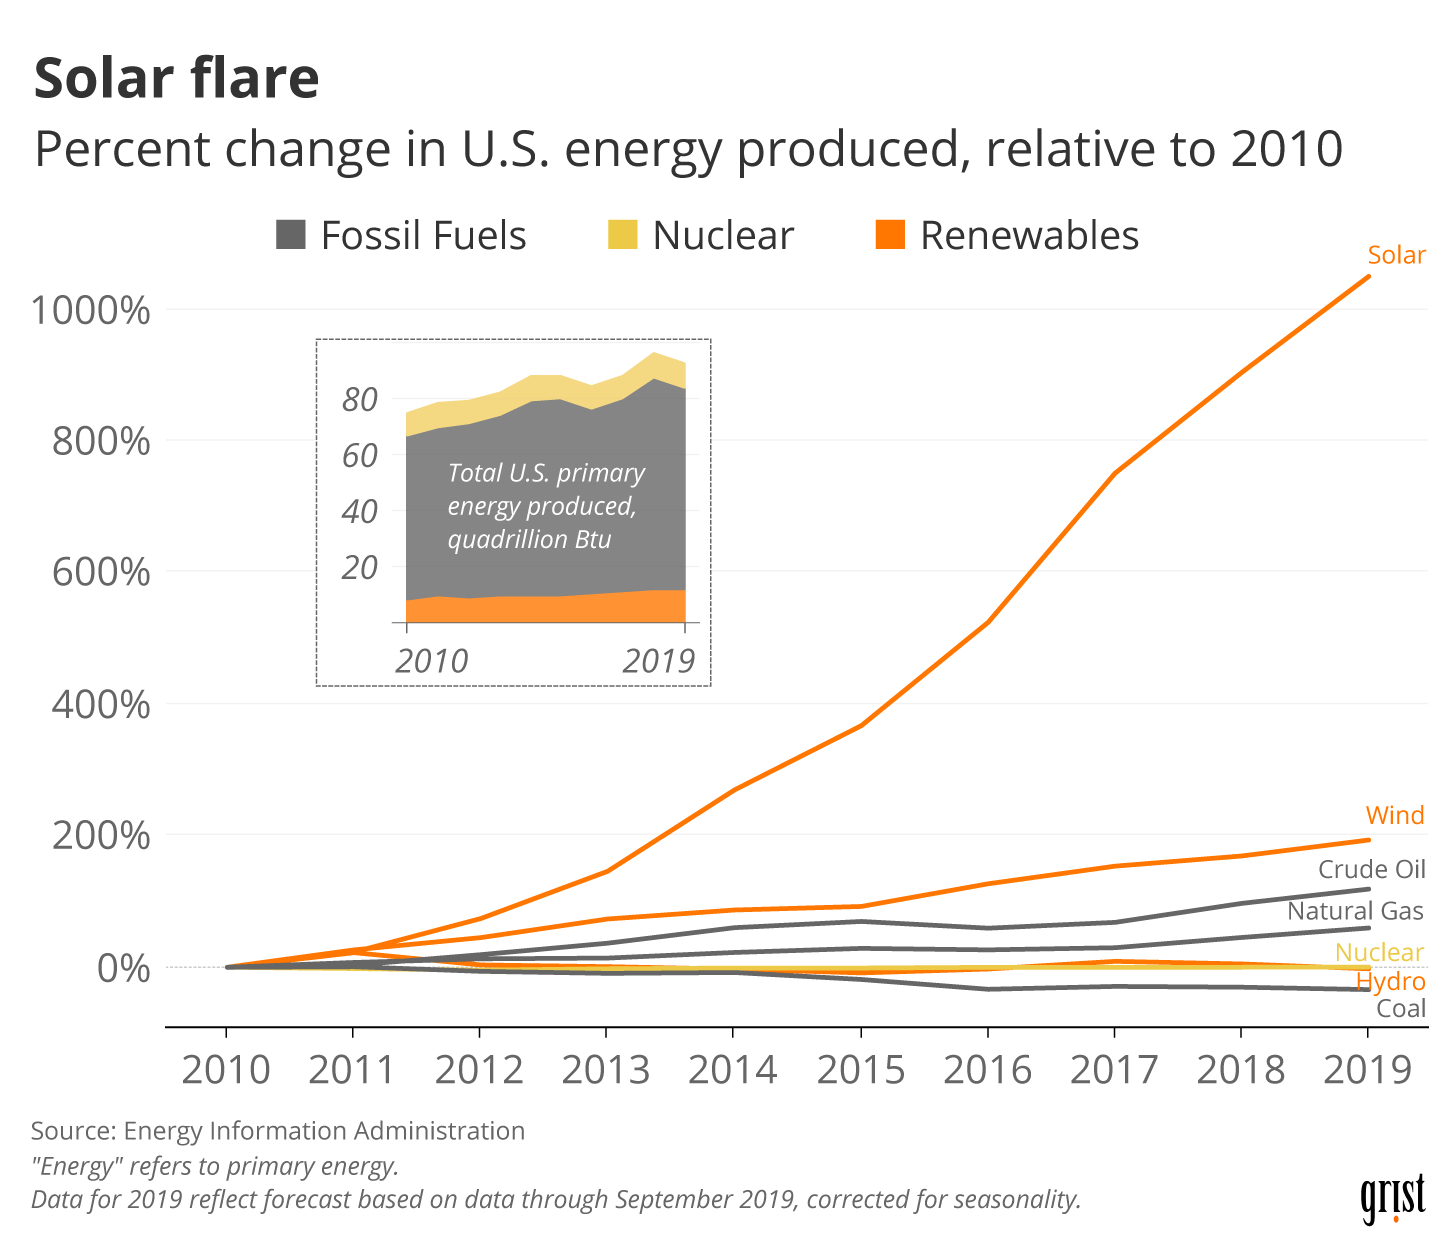
6. Solar skyrocketed, but fossil fuels still dominate.
Clayton Aldern / Grist
Despite coal’s rapid decline, fossil fuels continued to make up the vast majority of the U.S.’s energy mix this decade. But even though renewables didn’t make much of a dent in the overall energy mix — they still only made up about 11 percent of primary energy production in 2018 — a shift is clearly underway. Solar energy production increased by about 900 percent between 2010 and 2018, illustrating in stark terms the expansion of the U.S. solar industry. This figure is only expected to grow as analysts tabulate the end-of-decade values. Wind energy production, too, is estimated to have tripled since 2010.
Keep in mind that only about 38 percent of the total raw energy produced ends up feeding into the electric grid — the rest goes to other uses. In 2018, for example, about 70 percent of primary petroleum energy was used in the transportation sector, where it accounted for more than 90 percent of the sector’s energy consumption. Only about 1 percent of primary energy used in the electric power sector comes from oil. Nuclear power, on the other hand, exists wholly for the purpose of electricity generation. The country’s energy mix is a reminder that decarbonization means more than just greening our electric grid.
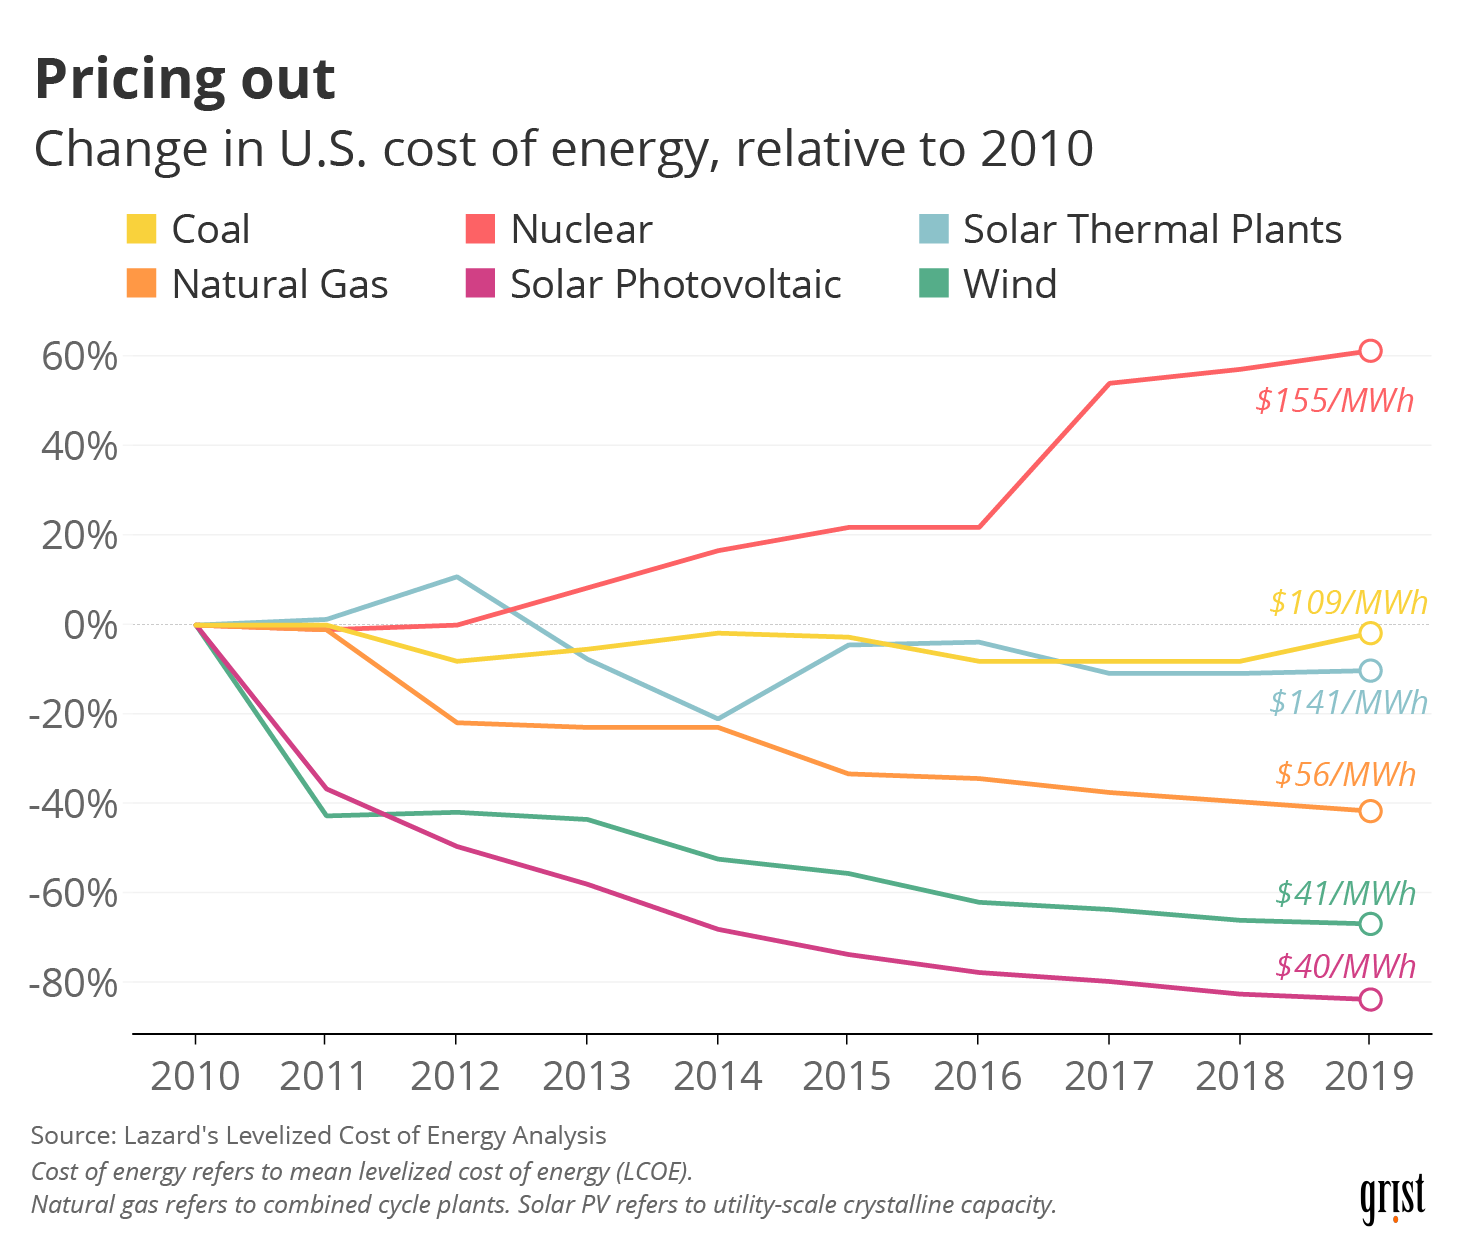
7. While coal flatlined, the price of renewables dropped precipitously.
Clayton Aldern / Grist
Natural gas wasn’t the only energy source that got cheaper this decade. Renewables also became more competitive on price. The cost of installing photovoltaic panels, whether for a rooftop array or a commercial-scale solar farm, dropped by about $5 per kilowatt since 2010. That’s thanks in part to the 30 percent federal solar investment tax credit (which is set to begin phasing out soon) but also to the slew of cities and states around the country that have passed renewable energy goals and created their own incentives.
As solar panels became cheaper and more efficient, Americans on both sides of the aisle furiously added them to their roofs, local governments set them up along the side of the highway, and farmers put them out to pasture. Solar panels still only make up a paltry 1.4 percent of our total electricity generation mix. But if wind and solar continue at their current rate of growth, the U.S. has a shot at 100 percent renewable energy by 2050.